Every stock in a squeeze today, ranked.
600+ stocks and ETFs on 12 timeframes, ranked by what held up in our 22-year backtest: a trigger inside the squeeze, several timeframes in a squeeze at once, and the trend up.
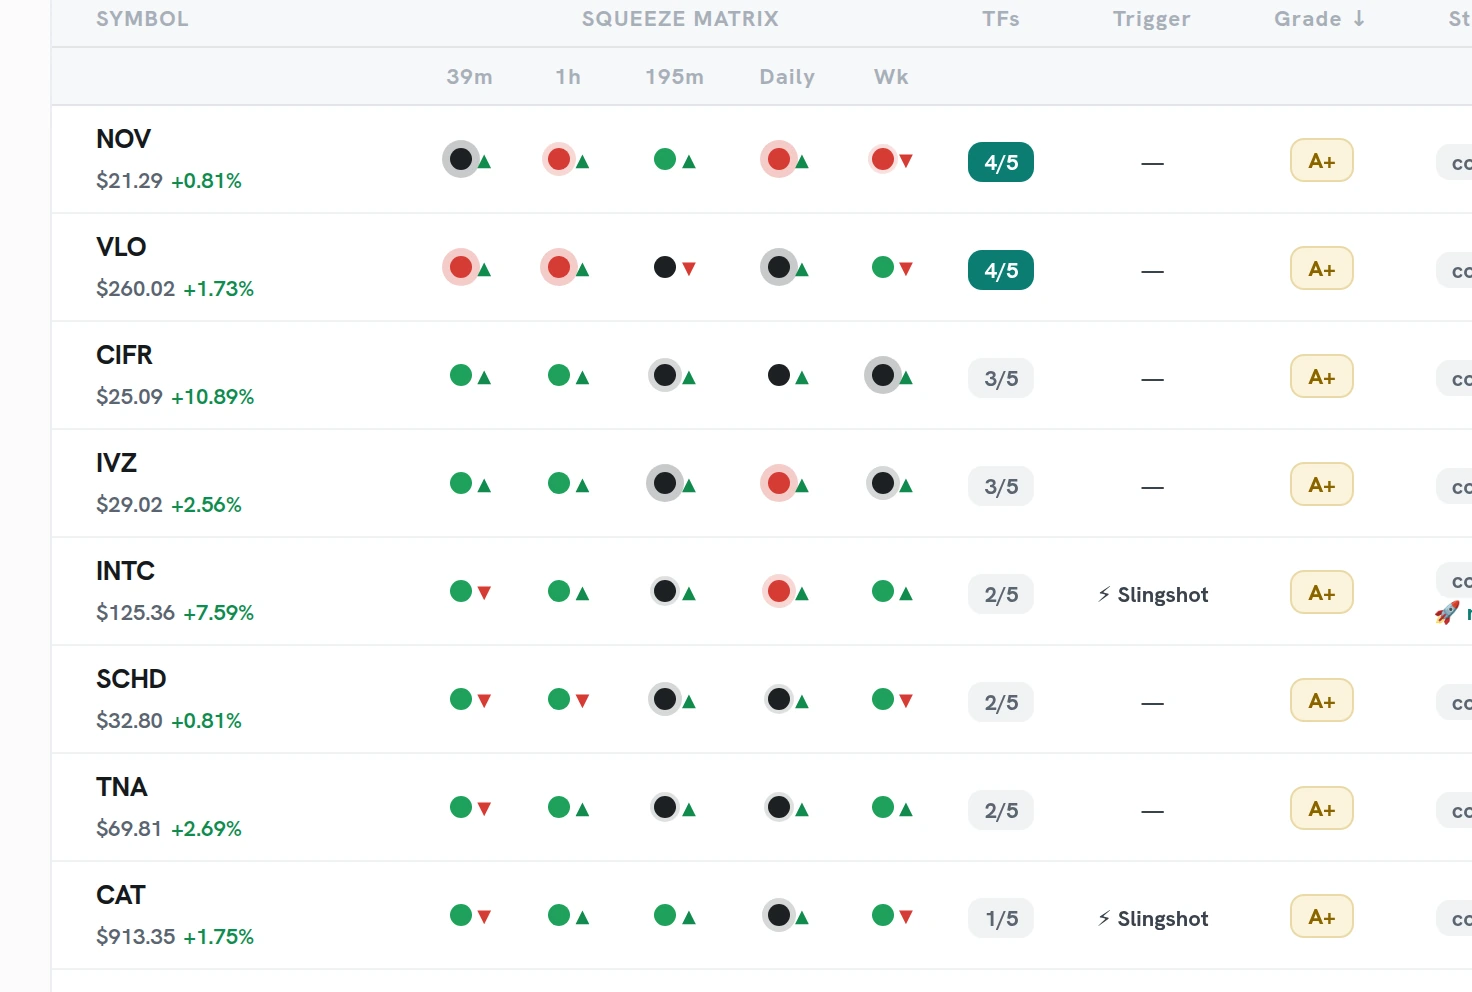
A squeeze by itself did not make money in our tests. A squeeze with a trigger and an uptrend did.
Compression alone is not an edge. In our backtests, what made the difference was what came with it: a trigger while the squeeze is still on, several timeframes in a squeeze together, and the trend stacked up. The 22-year record on each name is shown for context, not as a forecast.
See which squeezes have actually paid.
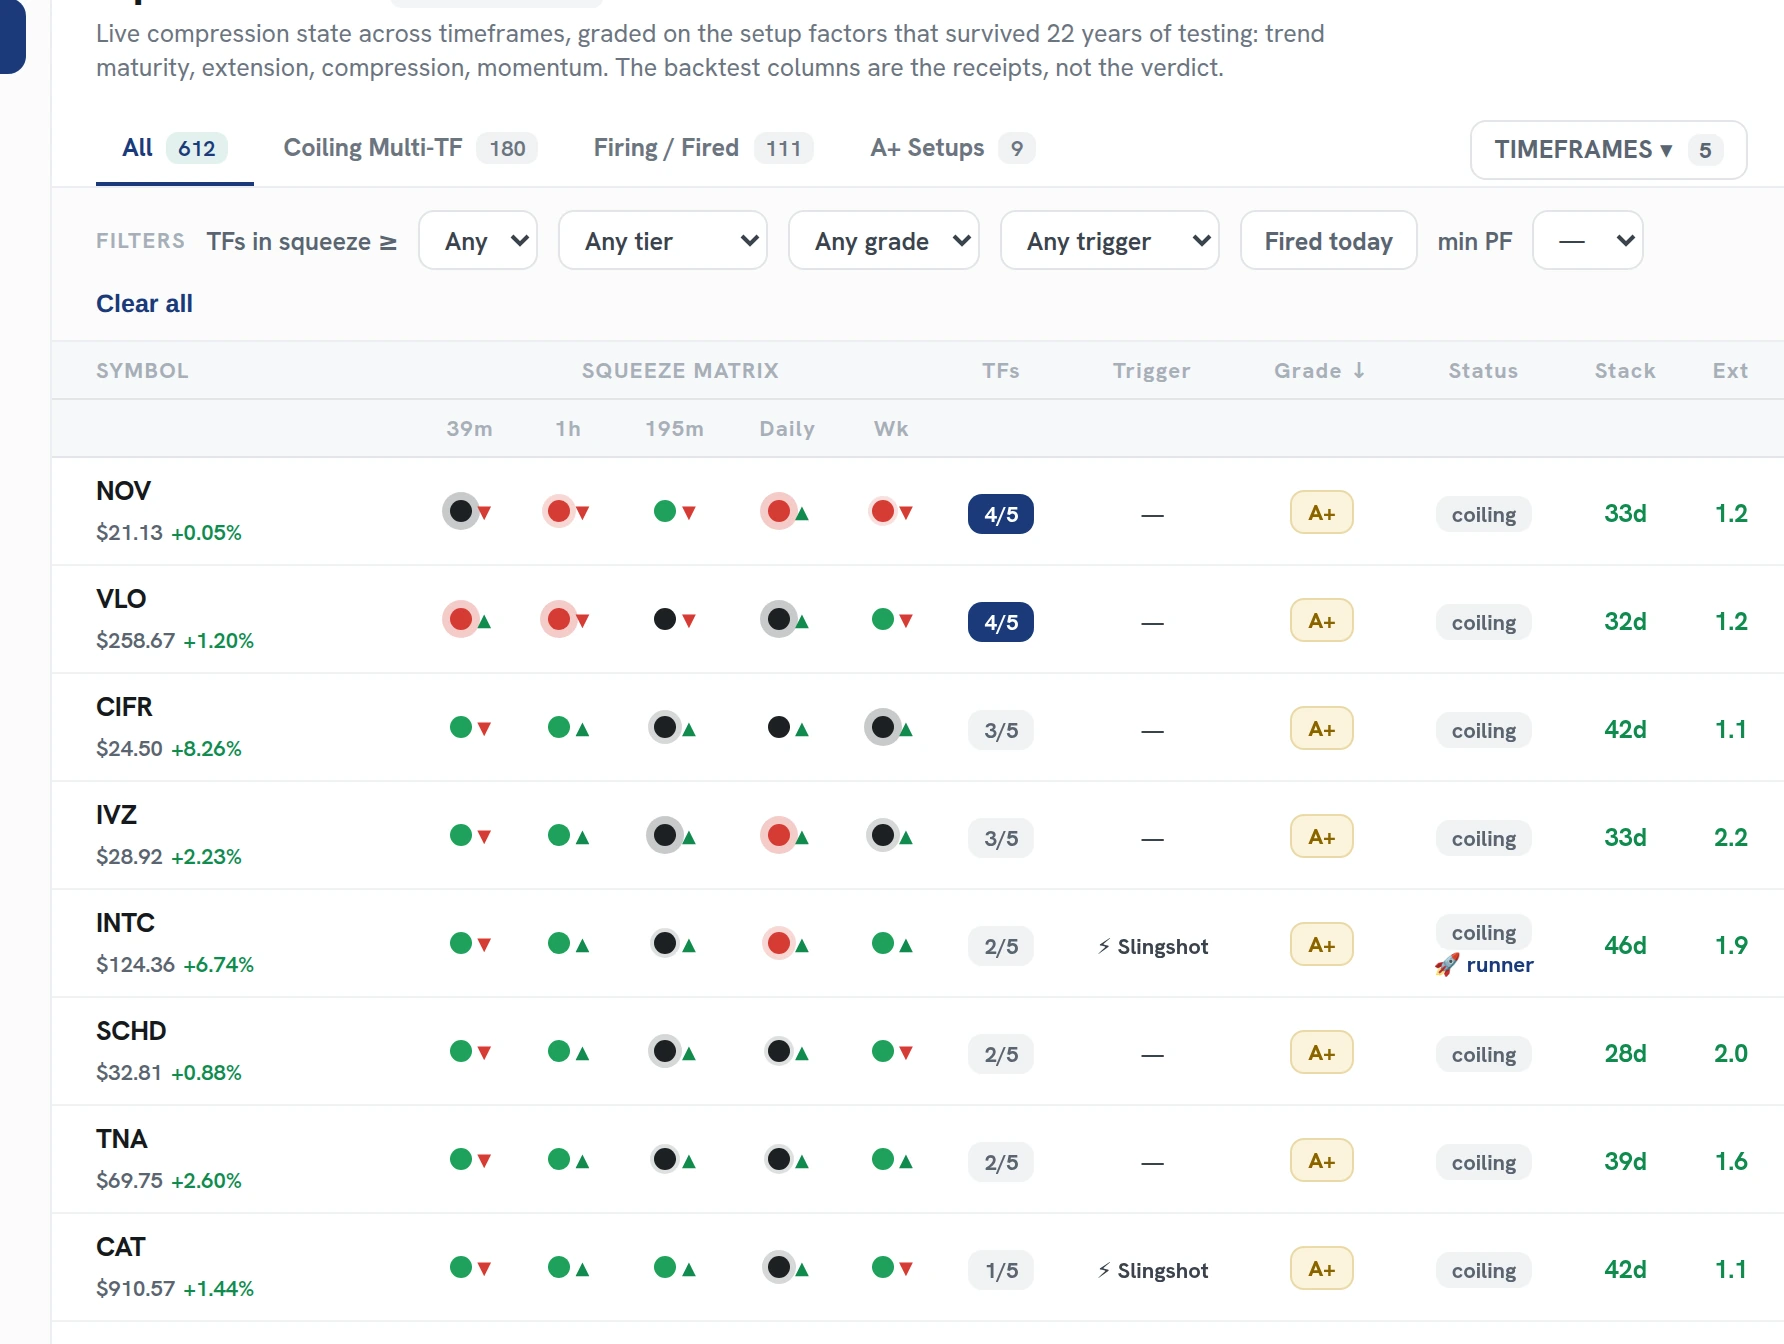
Every name carries its own 22-year squeeze backtest, and we rank by it. The setups that have carried a real edge rise to the top instead of just any compression. The colored dot tells you a squeeze is on; the ranking tells you whether it is worth your time.
Trade the Slingshot Squeeze, not just any squeeze.
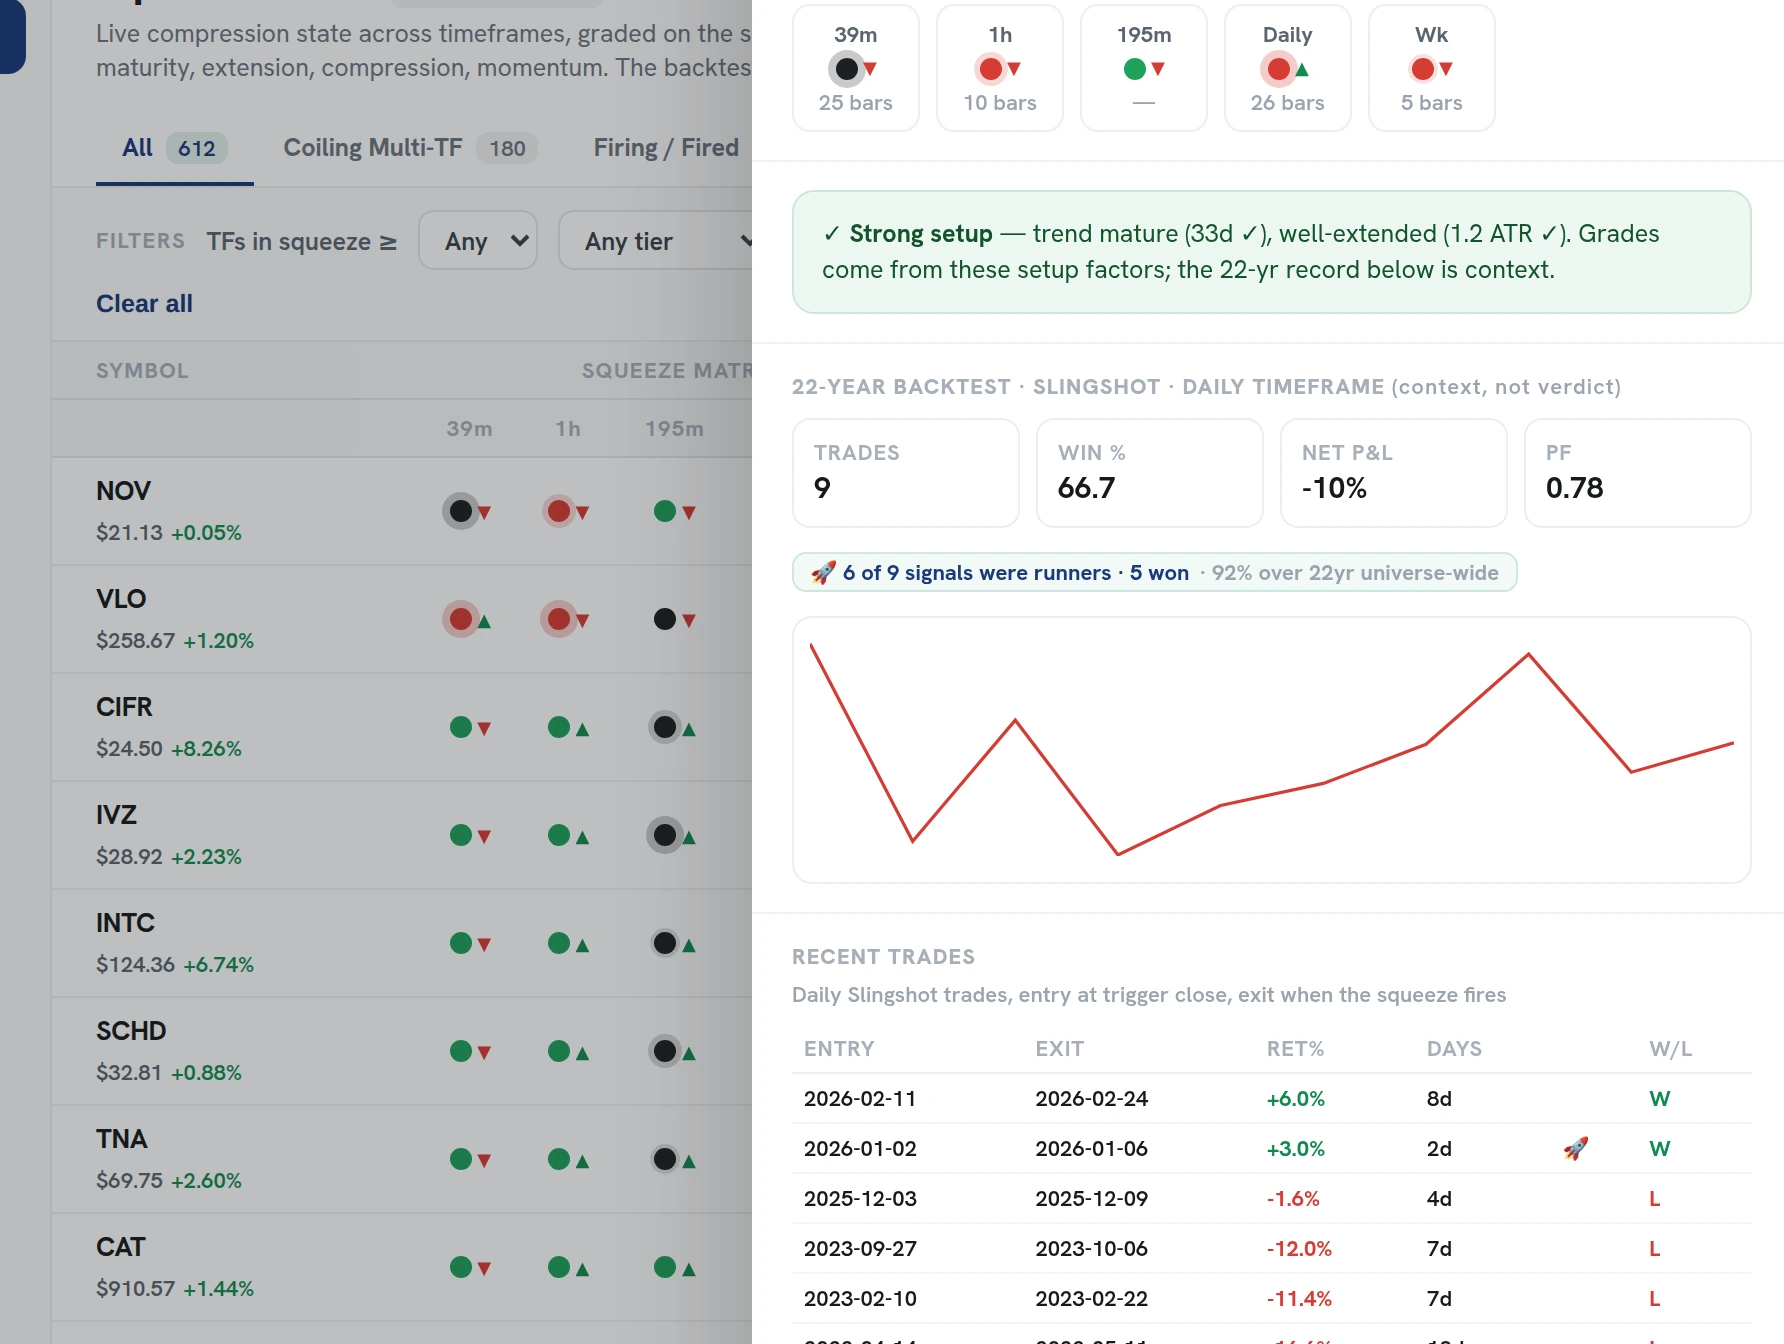
A bare squeeze is a coin flip. The Slingshot Squeeze is the real signal: a squeeze still on, momentum turning up from below zero, and the trend stacked behind it. You enter on the turn, while the dots are still on. The green-dot fire is your exit, not your entry.
Multi-timeframe squeezes, at a glance.
See one name's squeeze across the 39-minute, hour, 195-minute, daily, and weekly side by side, including the timeframes most charting tools cannot even screen for. When they stack up the same way, that is your signal.
Almost half of these moves never look back.
The most common advice is to wait for the pullback. Our 22-year backtests say the opposite: 46% of signals never pulled back even one ATR, and those runners were the best trades in the entire sample.
Traders who waited for a 1-ATR pullback missed 46% of the trades, and those were the best ones. That is why the playbook is simple: enter on the trigger, add on the pullback if it comes.
Every ranking traces back to a study.
Each signal we rank by is there because it moved the numbers in a 22-year, 6,557-trade backtest, and you can open the receipts on any symbol you are looking at.
Edge, confluence, and trend decide the rank
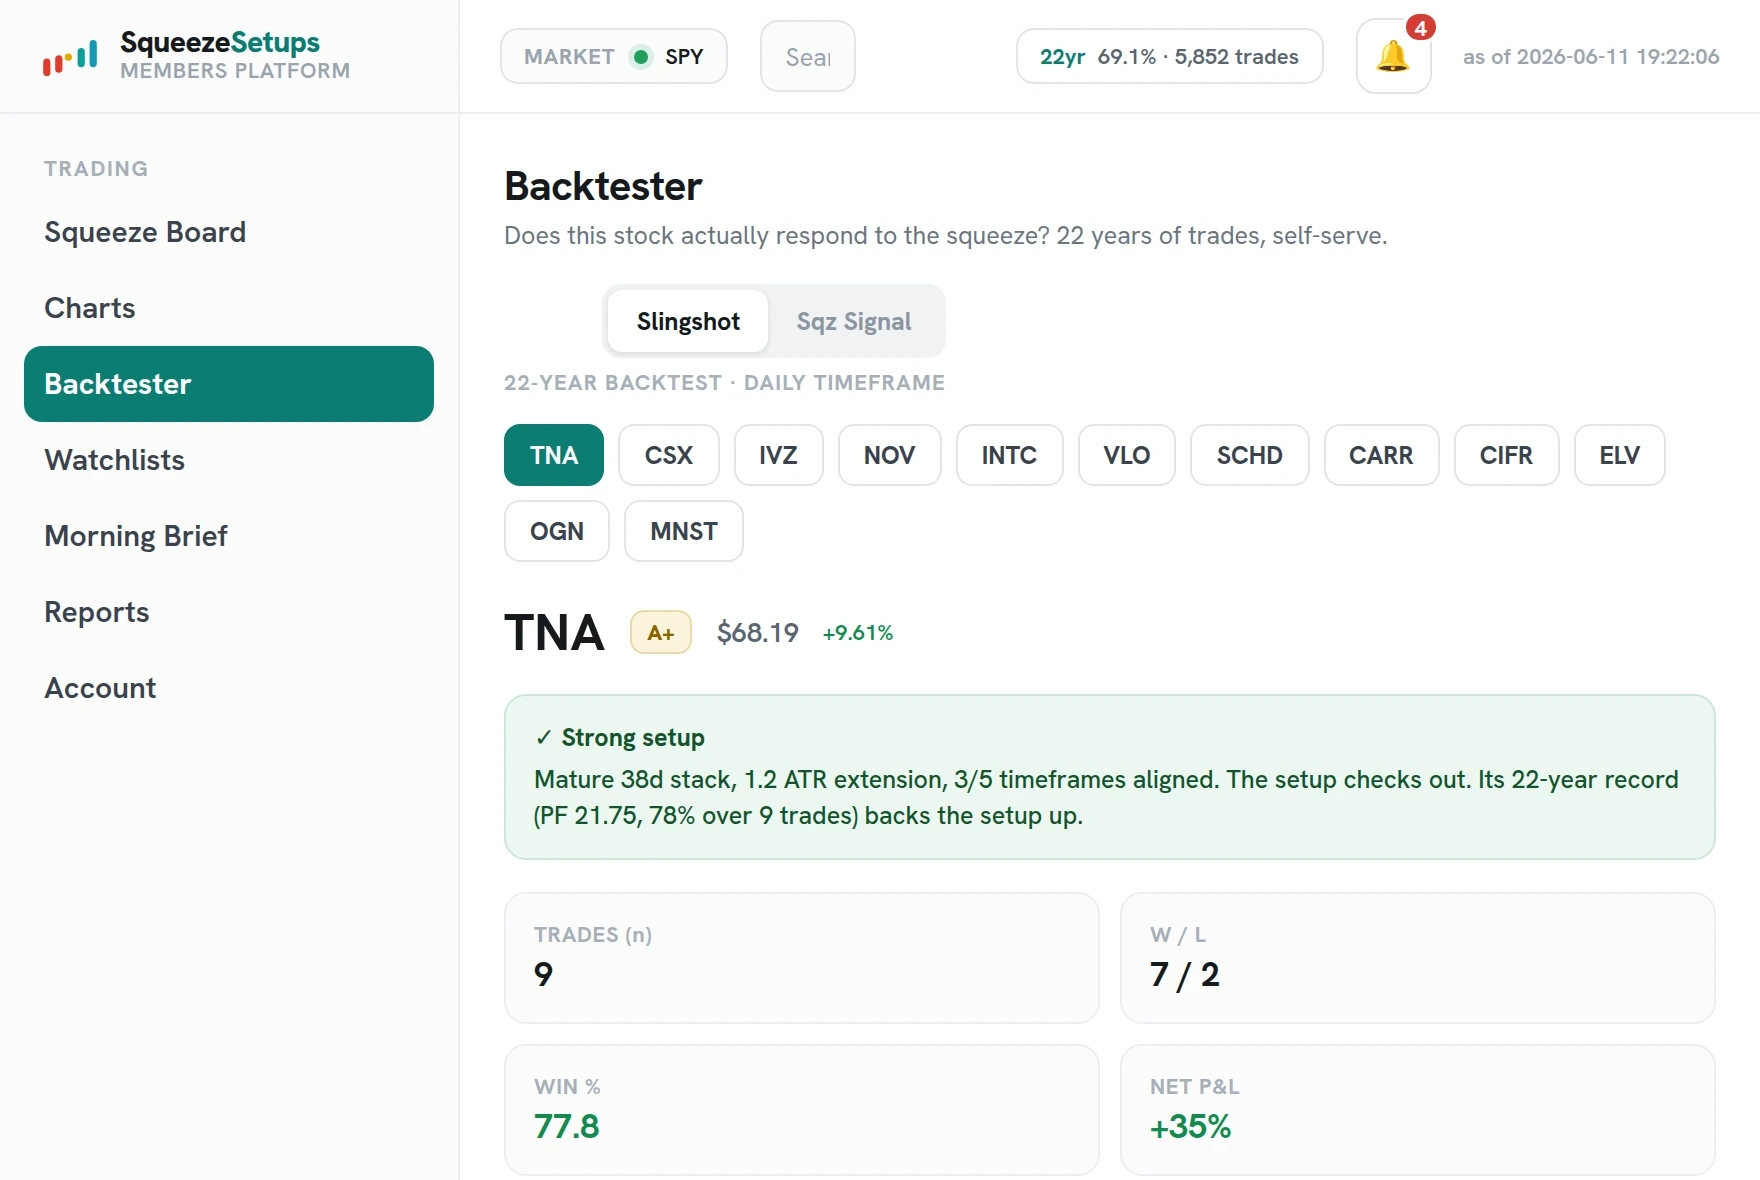
The 22-year backtest edge on the name, how many timeframes are squeezing together, and whether the trend is stacked up. Three things, each measured the same way on every setup.
22 years on every symbol
Every name carries its own trade-by-trade backtest: entries, exits, wins, losses, and flat stretches. It is the edge behind the rank, not a promise about the next trade.
Not every era was good
From 2004 to 2021 the win rate ran between 67% and 71%. Since 2022 it has been weaker: 61% of 1,473 trades won and the average trade was about flat. We show the bad years too.
One platform, from scan to short list.
Everything between "a squeeze exists" and "this one is worth taking" lives in one place.
Squeeze Board
Every active squeeze across 600+ stocks and ETFs on one live board, ranked by backtest edge, timeframe confluence, and trend.
Learn more →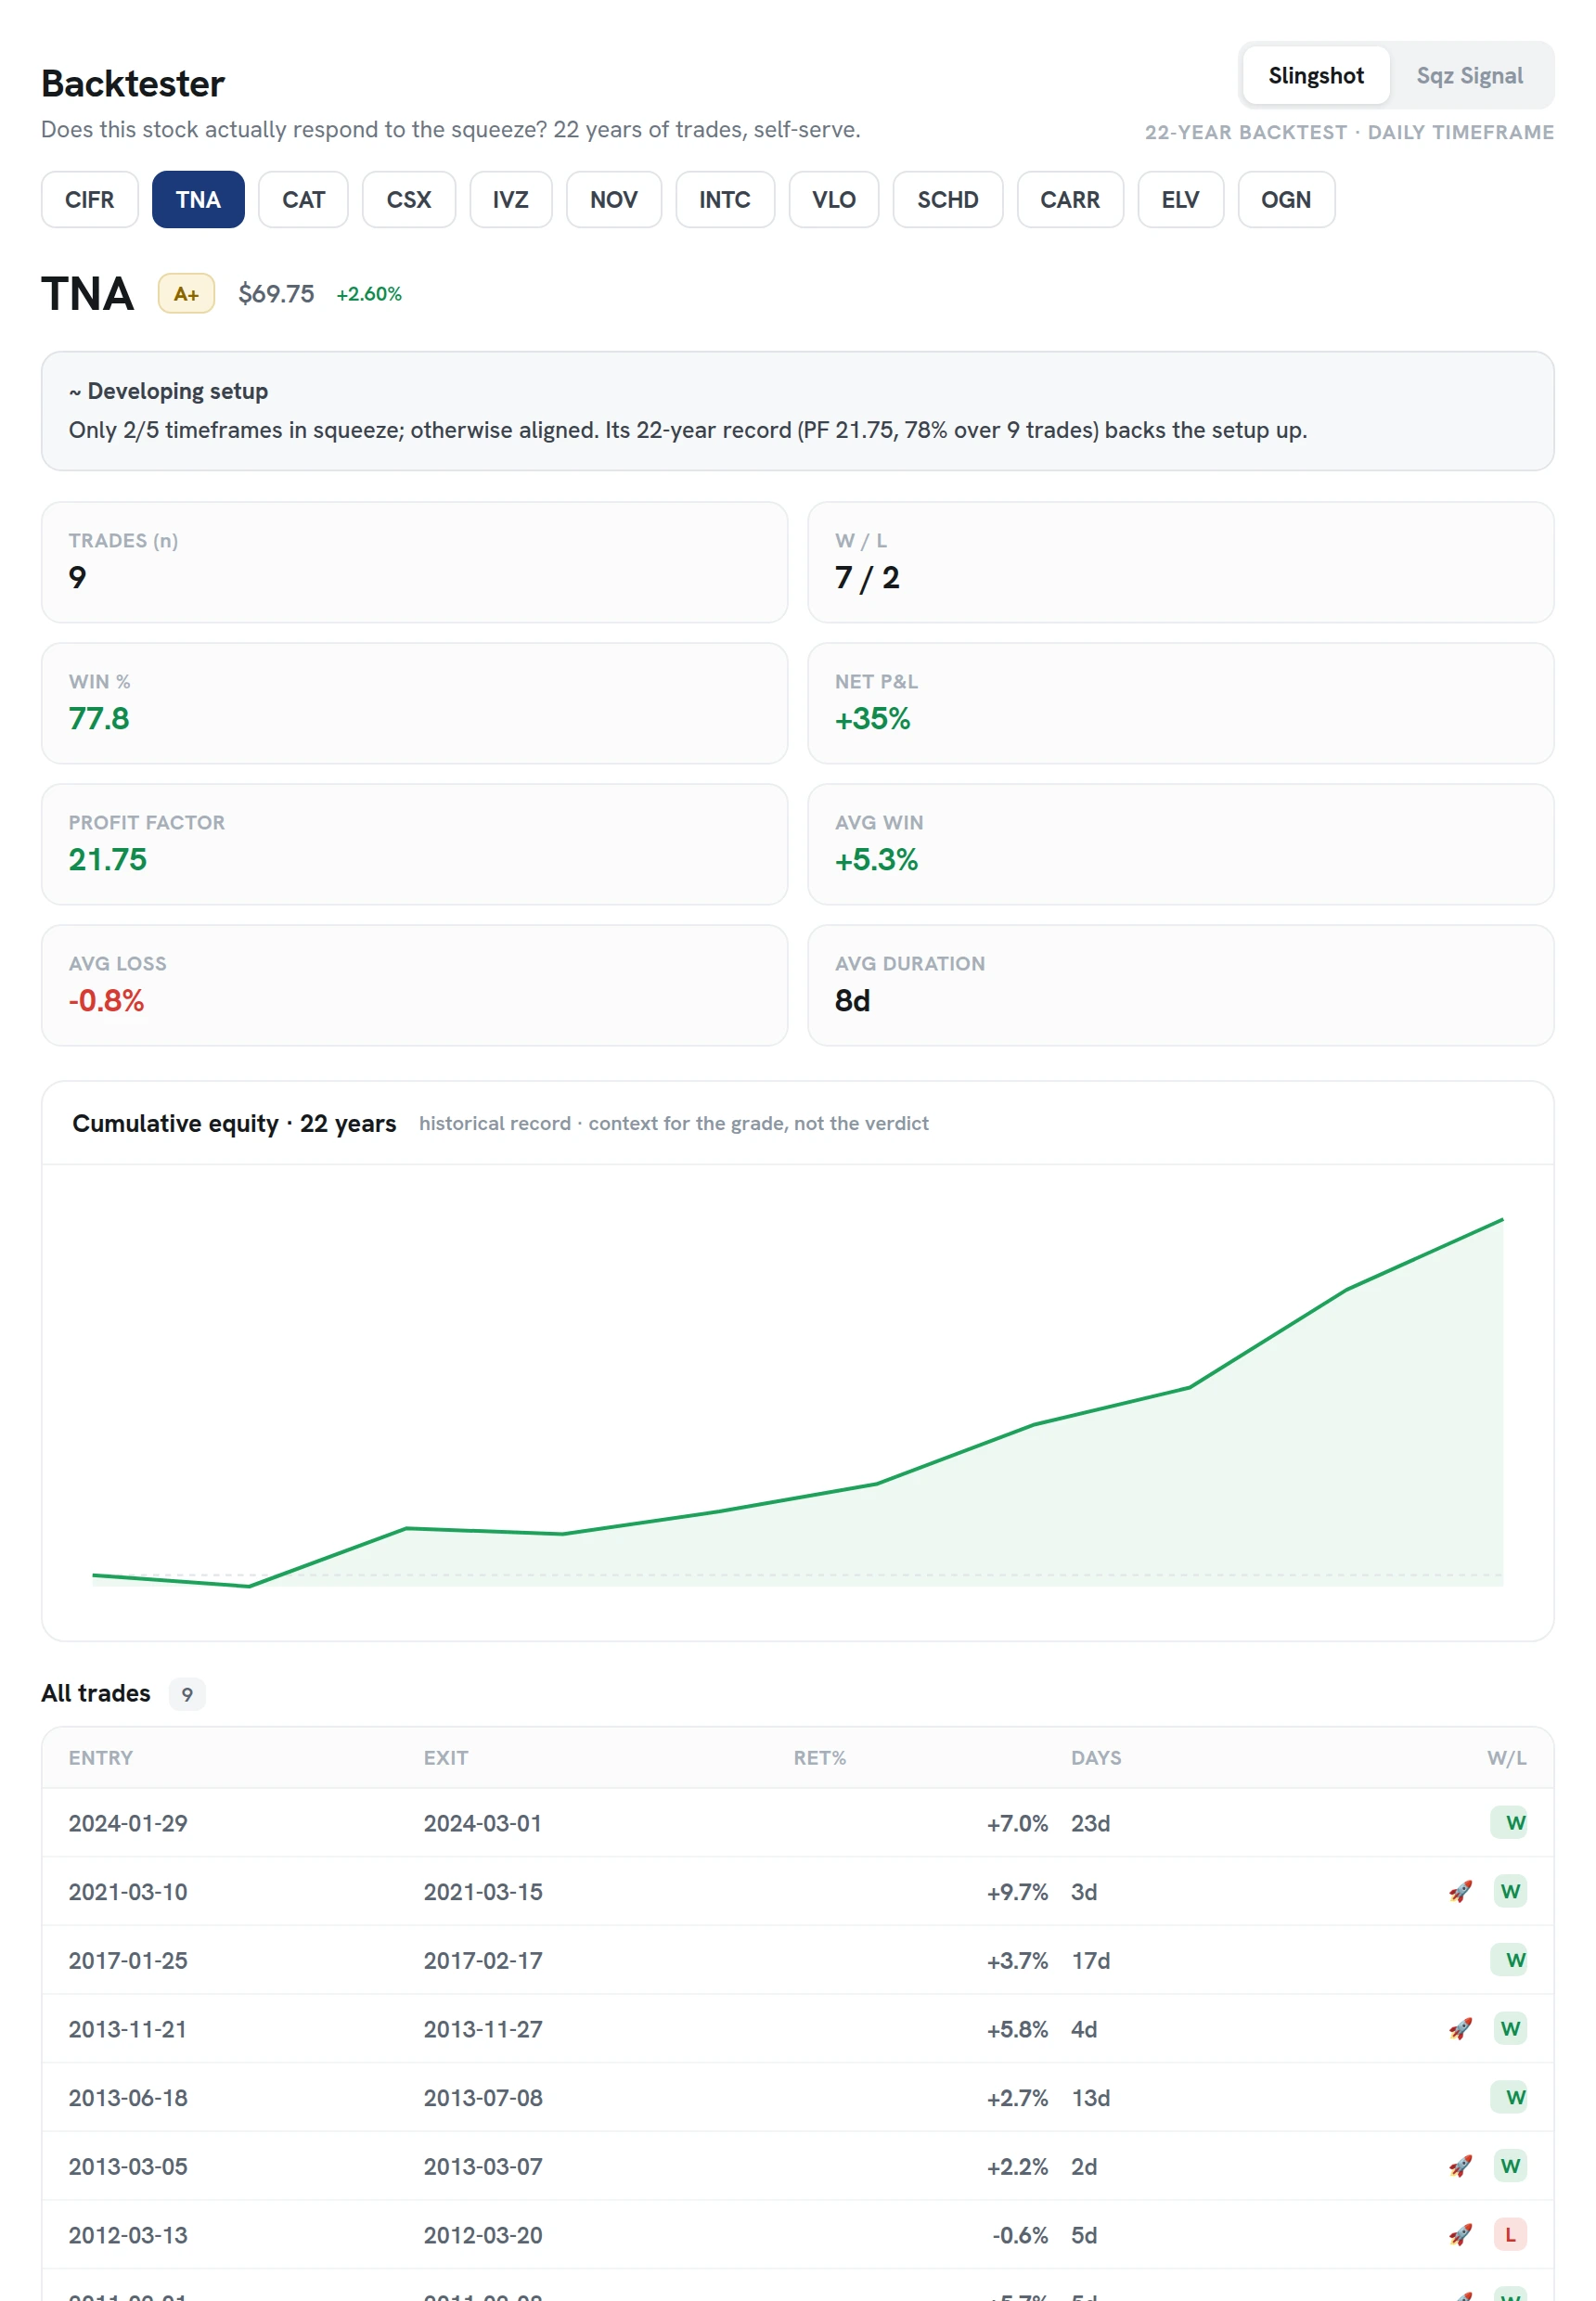
22-Year Backtester
The full historical record behind every symbol, 2004 to today, laid out trade by trade.
Learn more →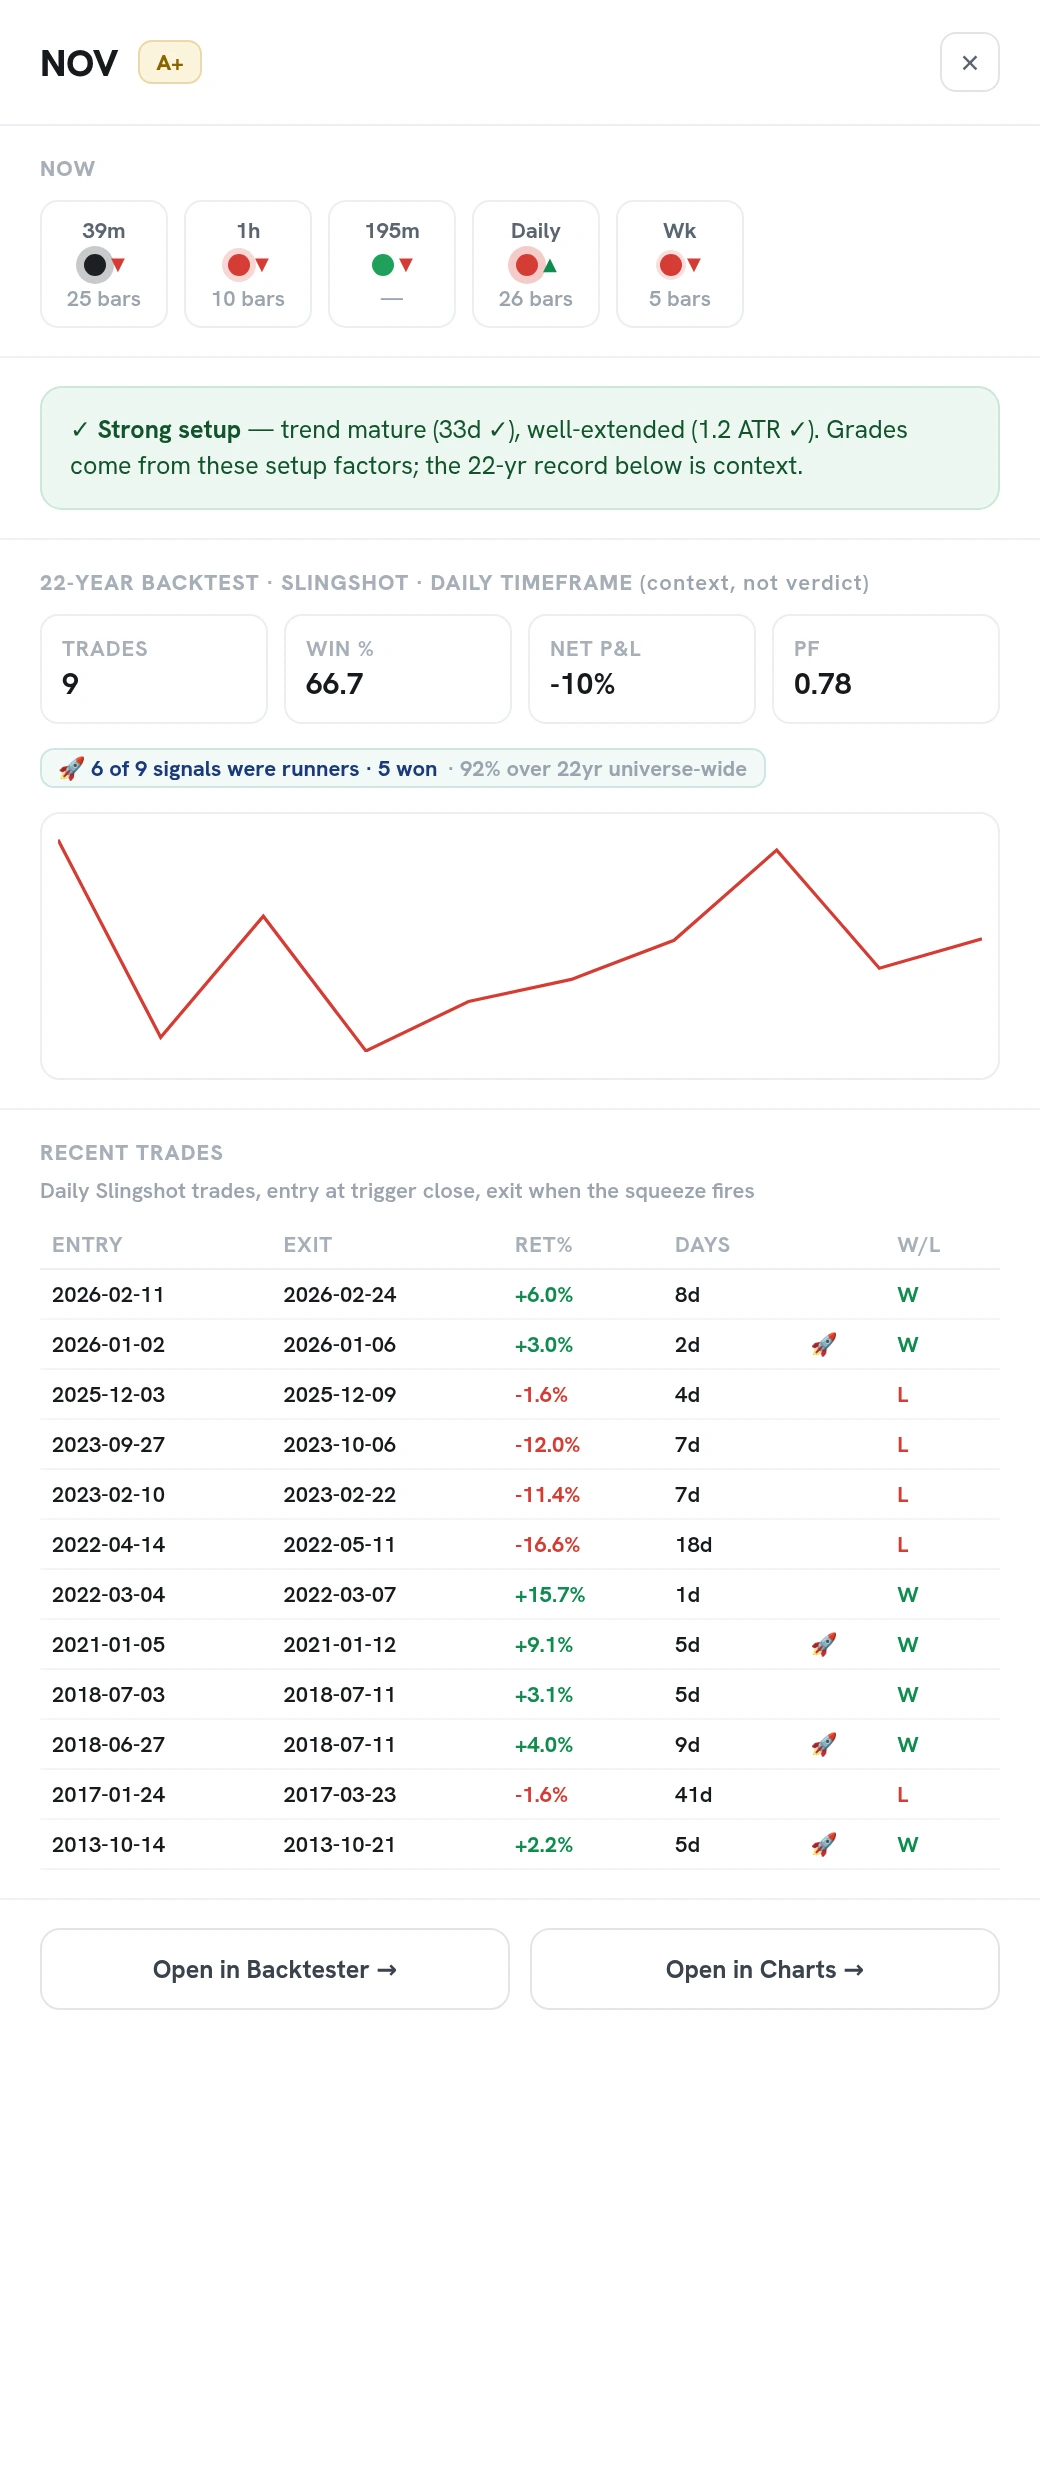
How Setups Rank
Each setup ranked by backtest edge, timeframe confluence, and trend, with the reasons spelled out.
Learn more →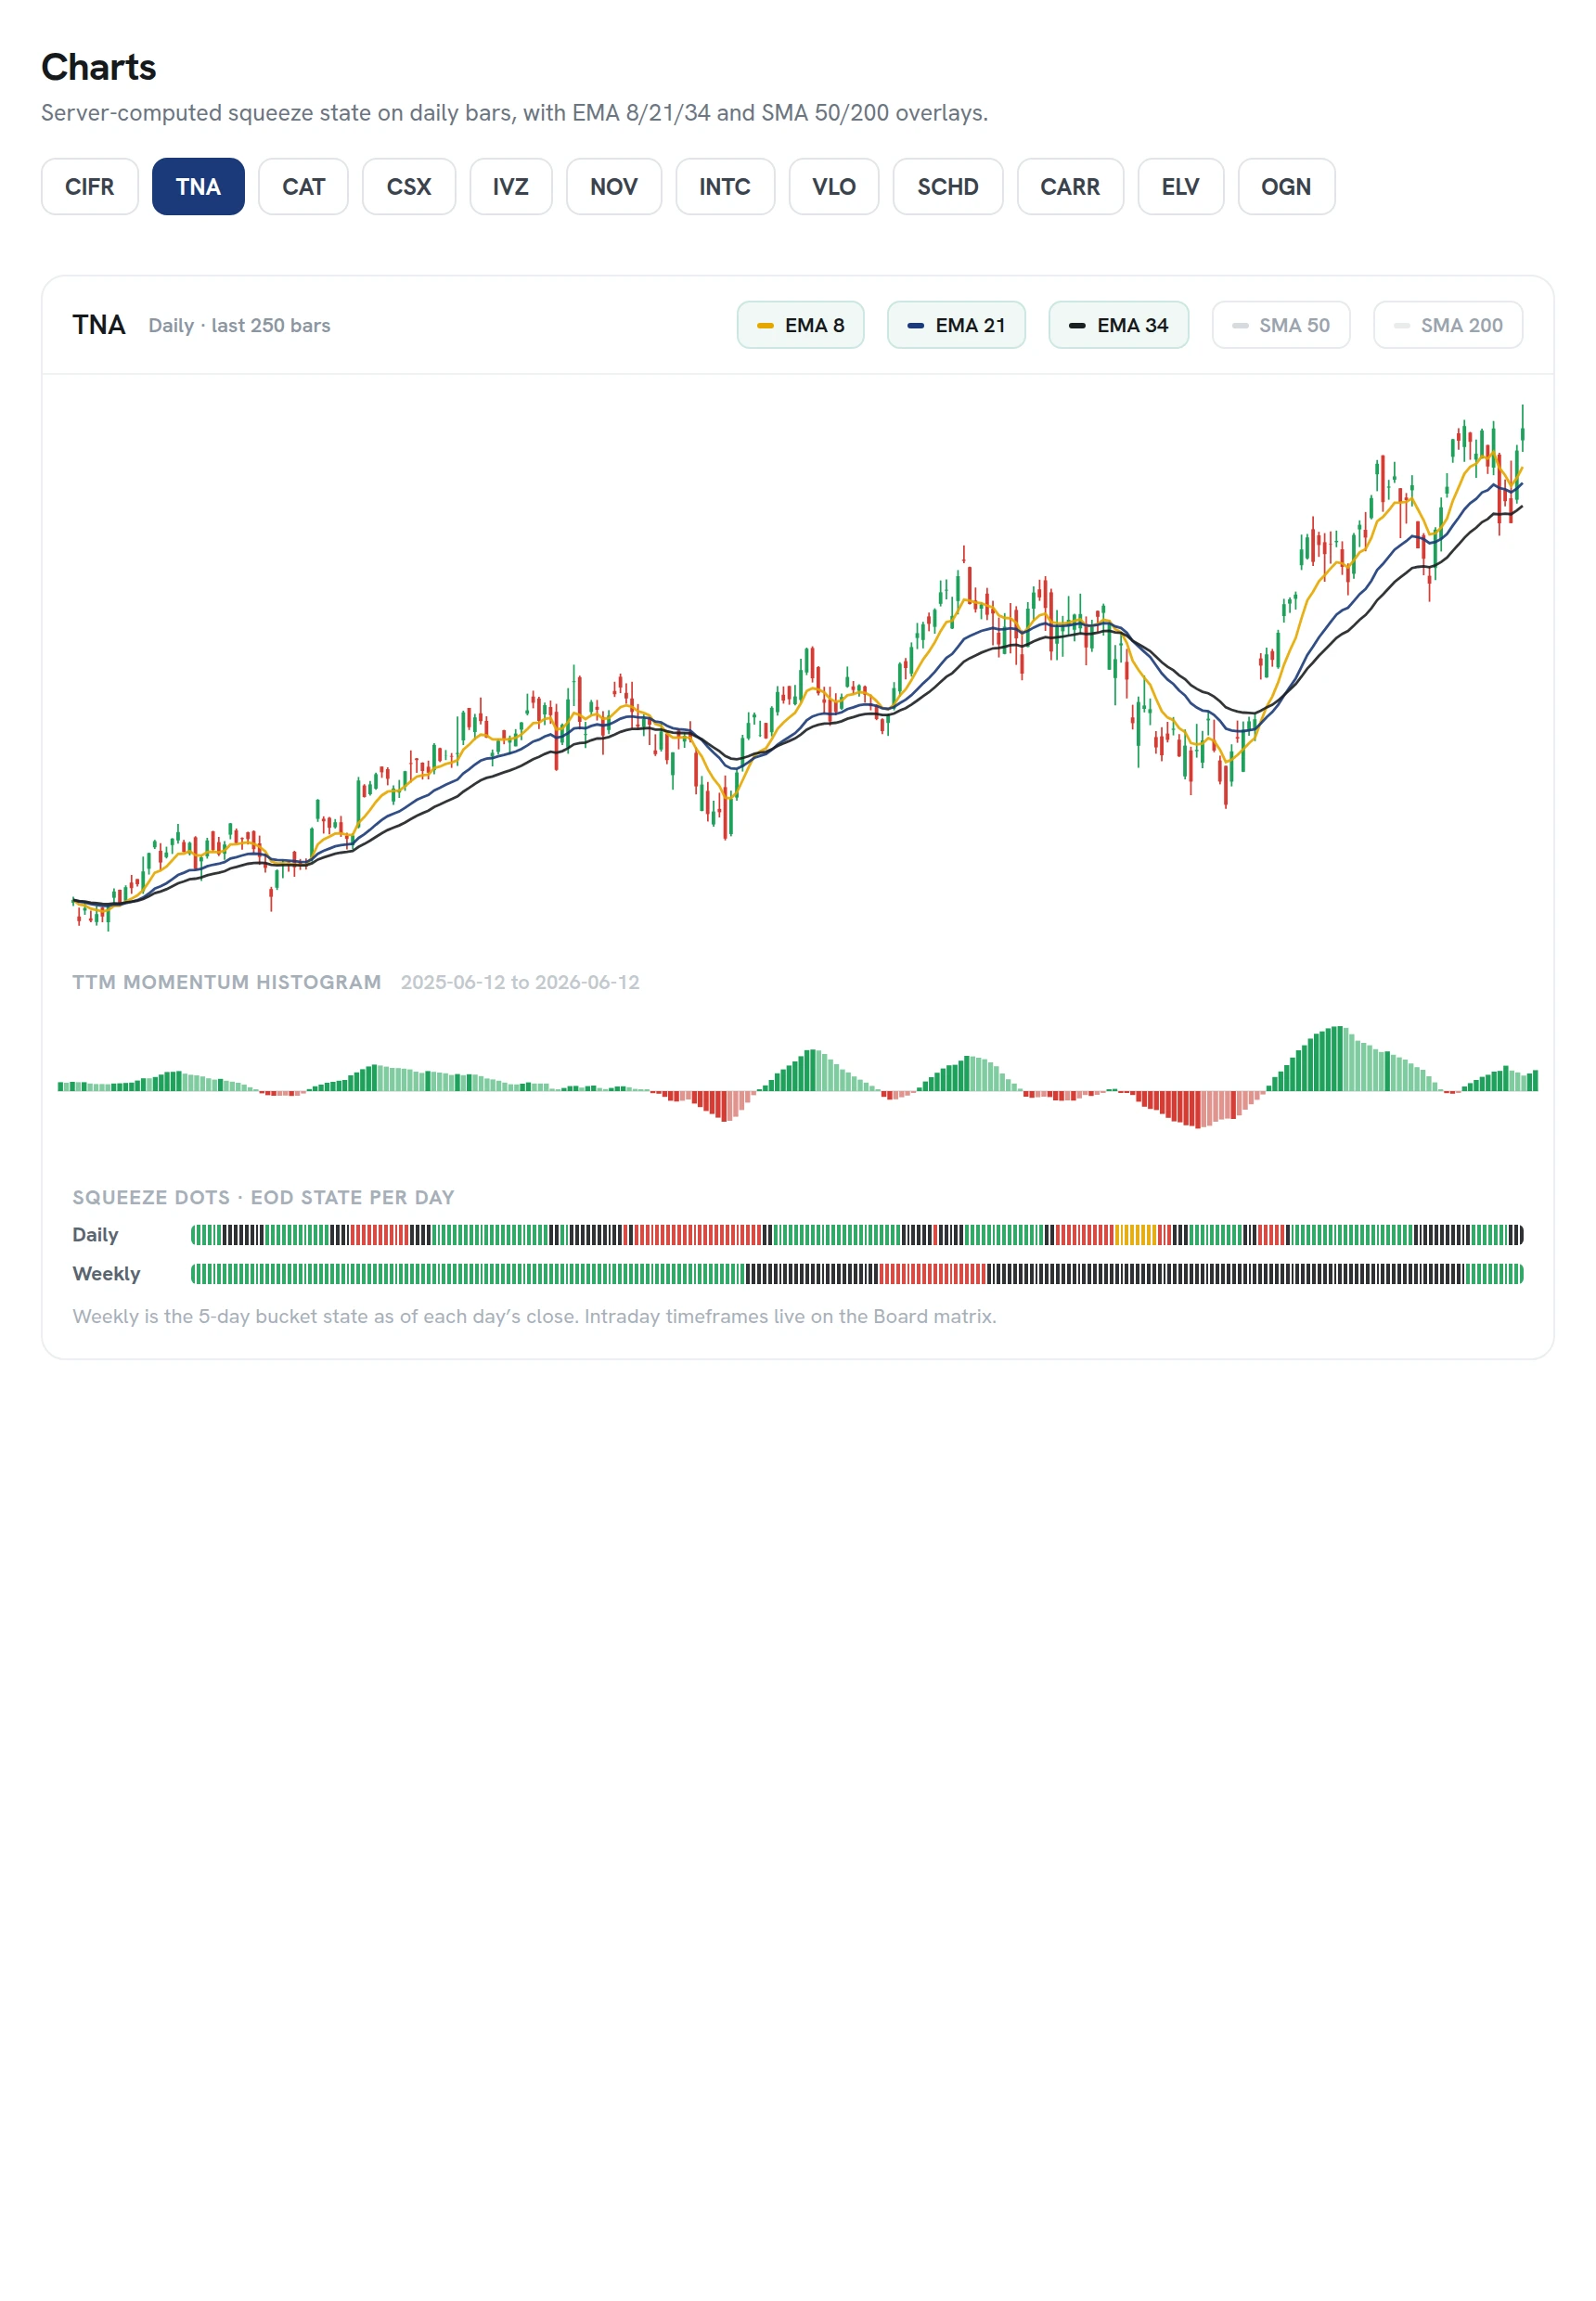
Multi-Timeframe Matrix
Twelve timeframes per symbol, 5-minute to weekly, side by side. See when compressions line up.
Learn more →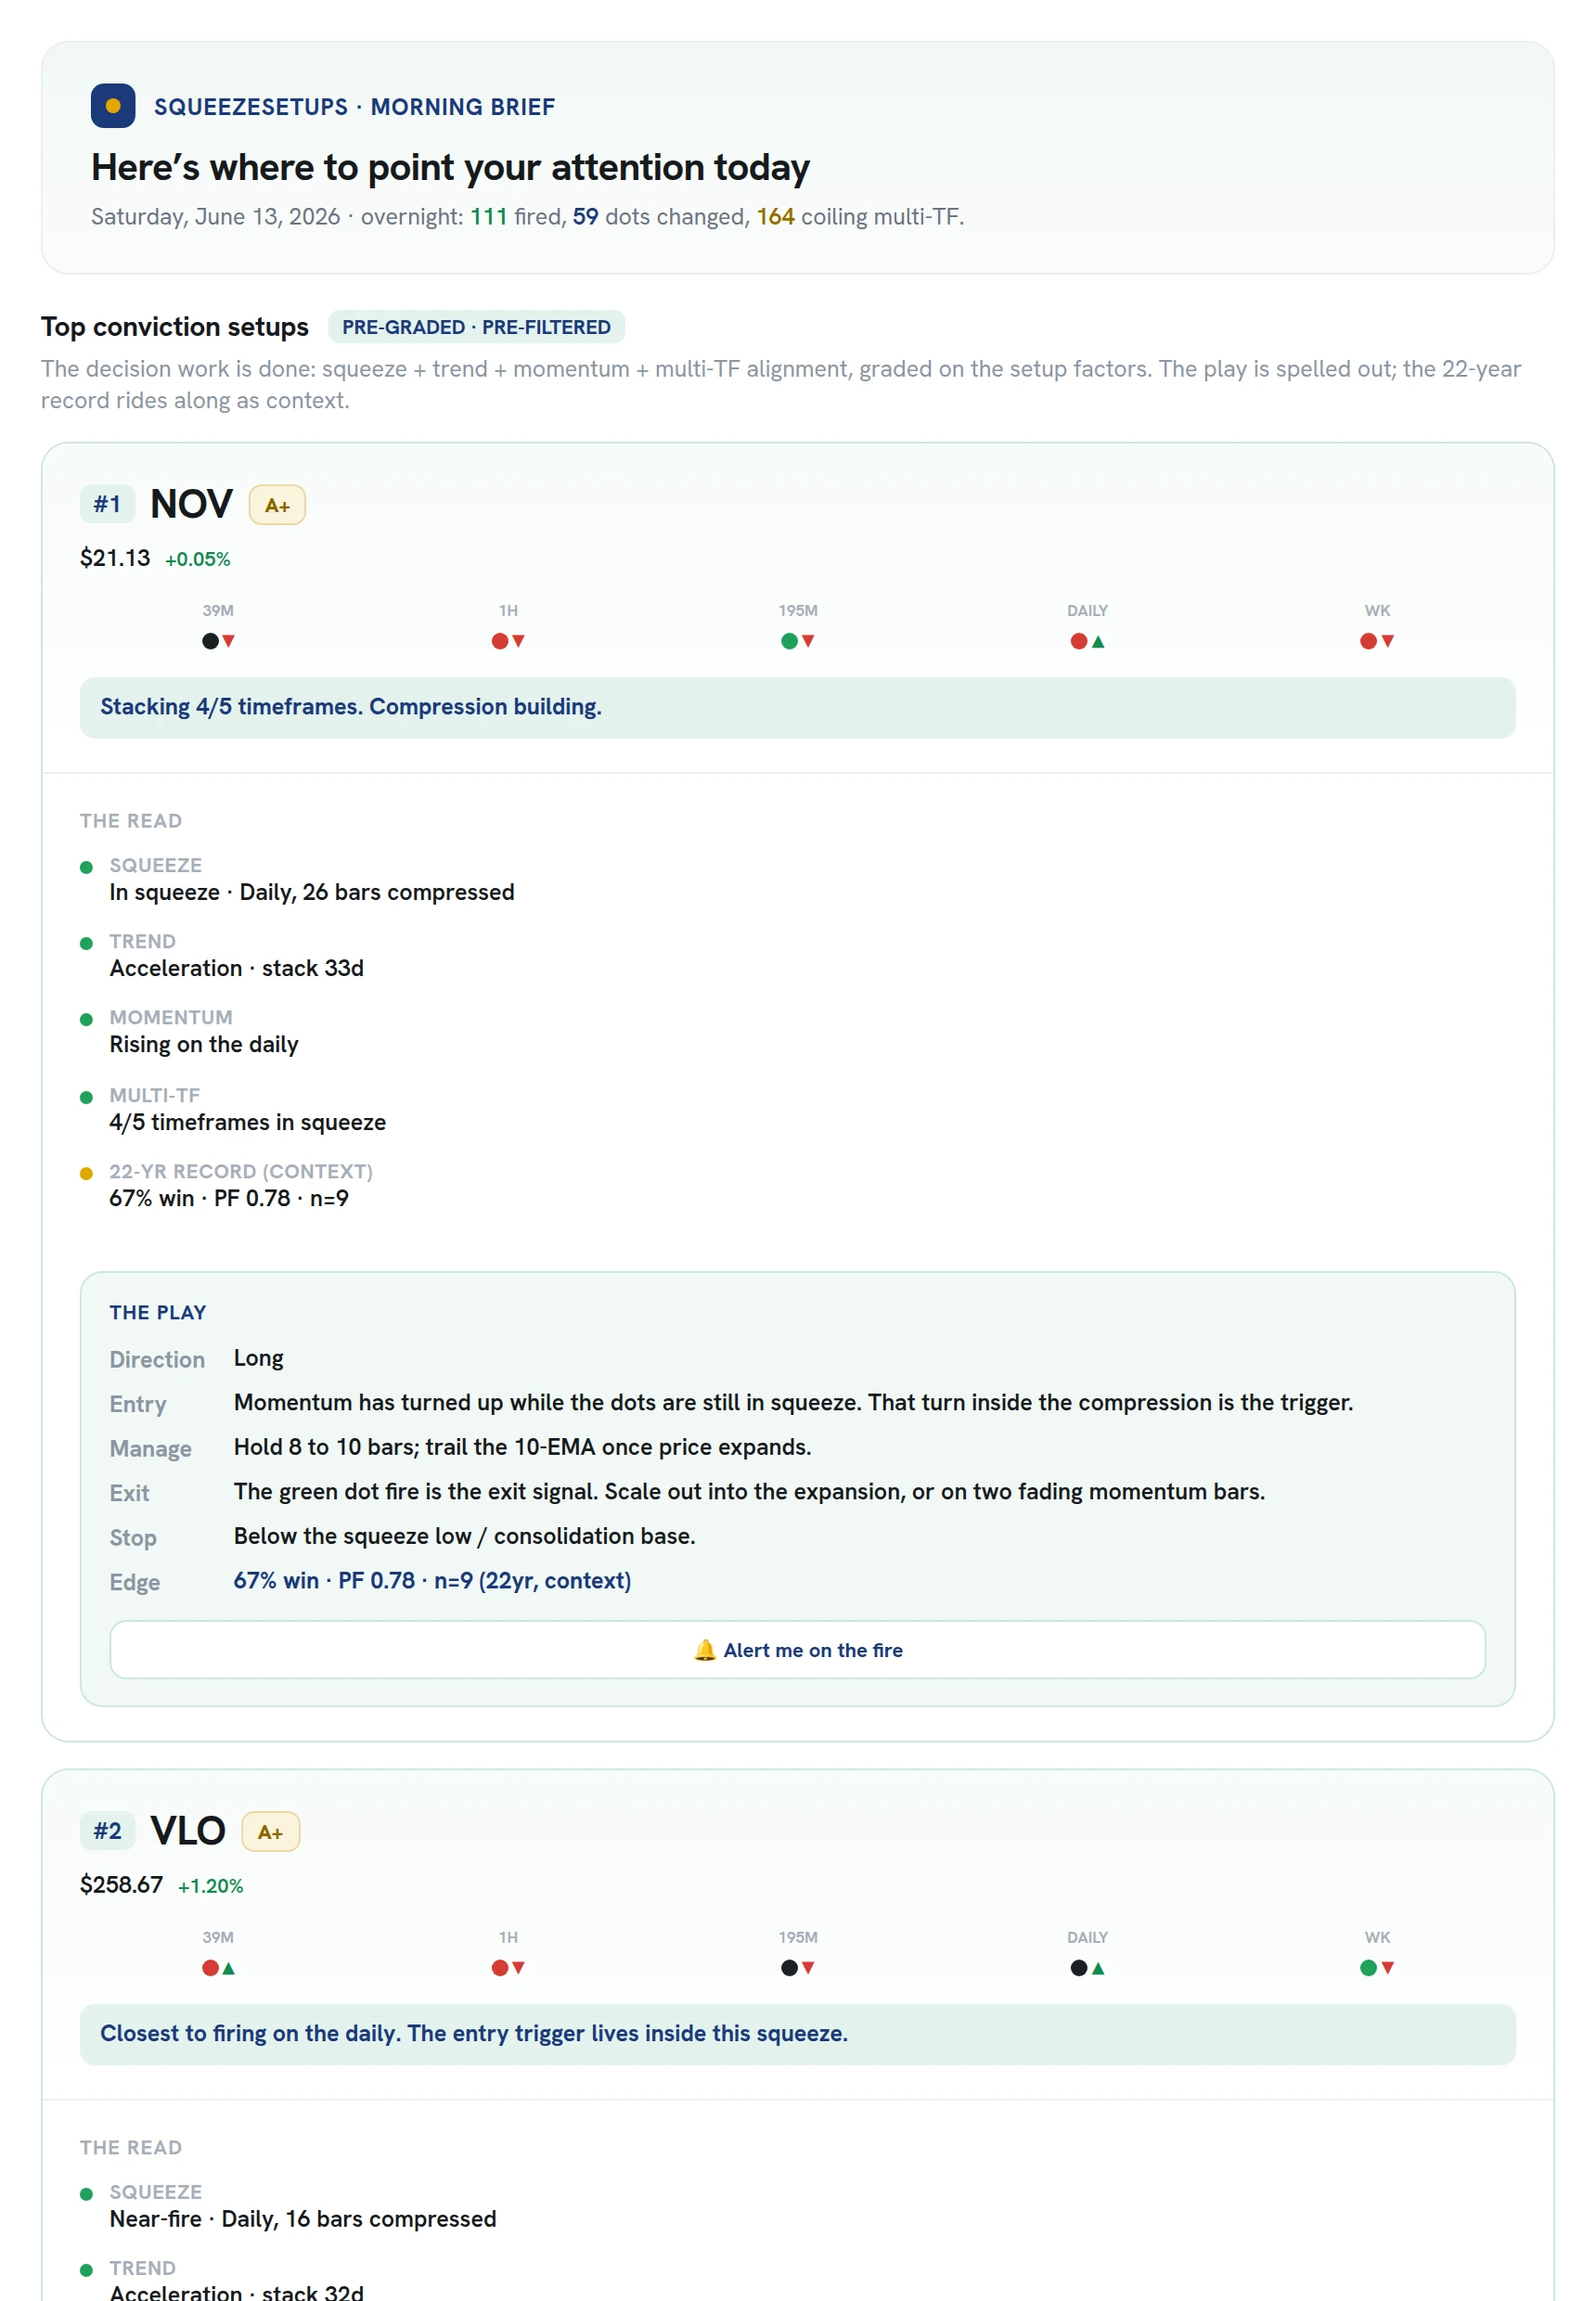
Morning Brief
Before the open: which setups are live, which are closest to firing, and what changed overnight.
Learn more →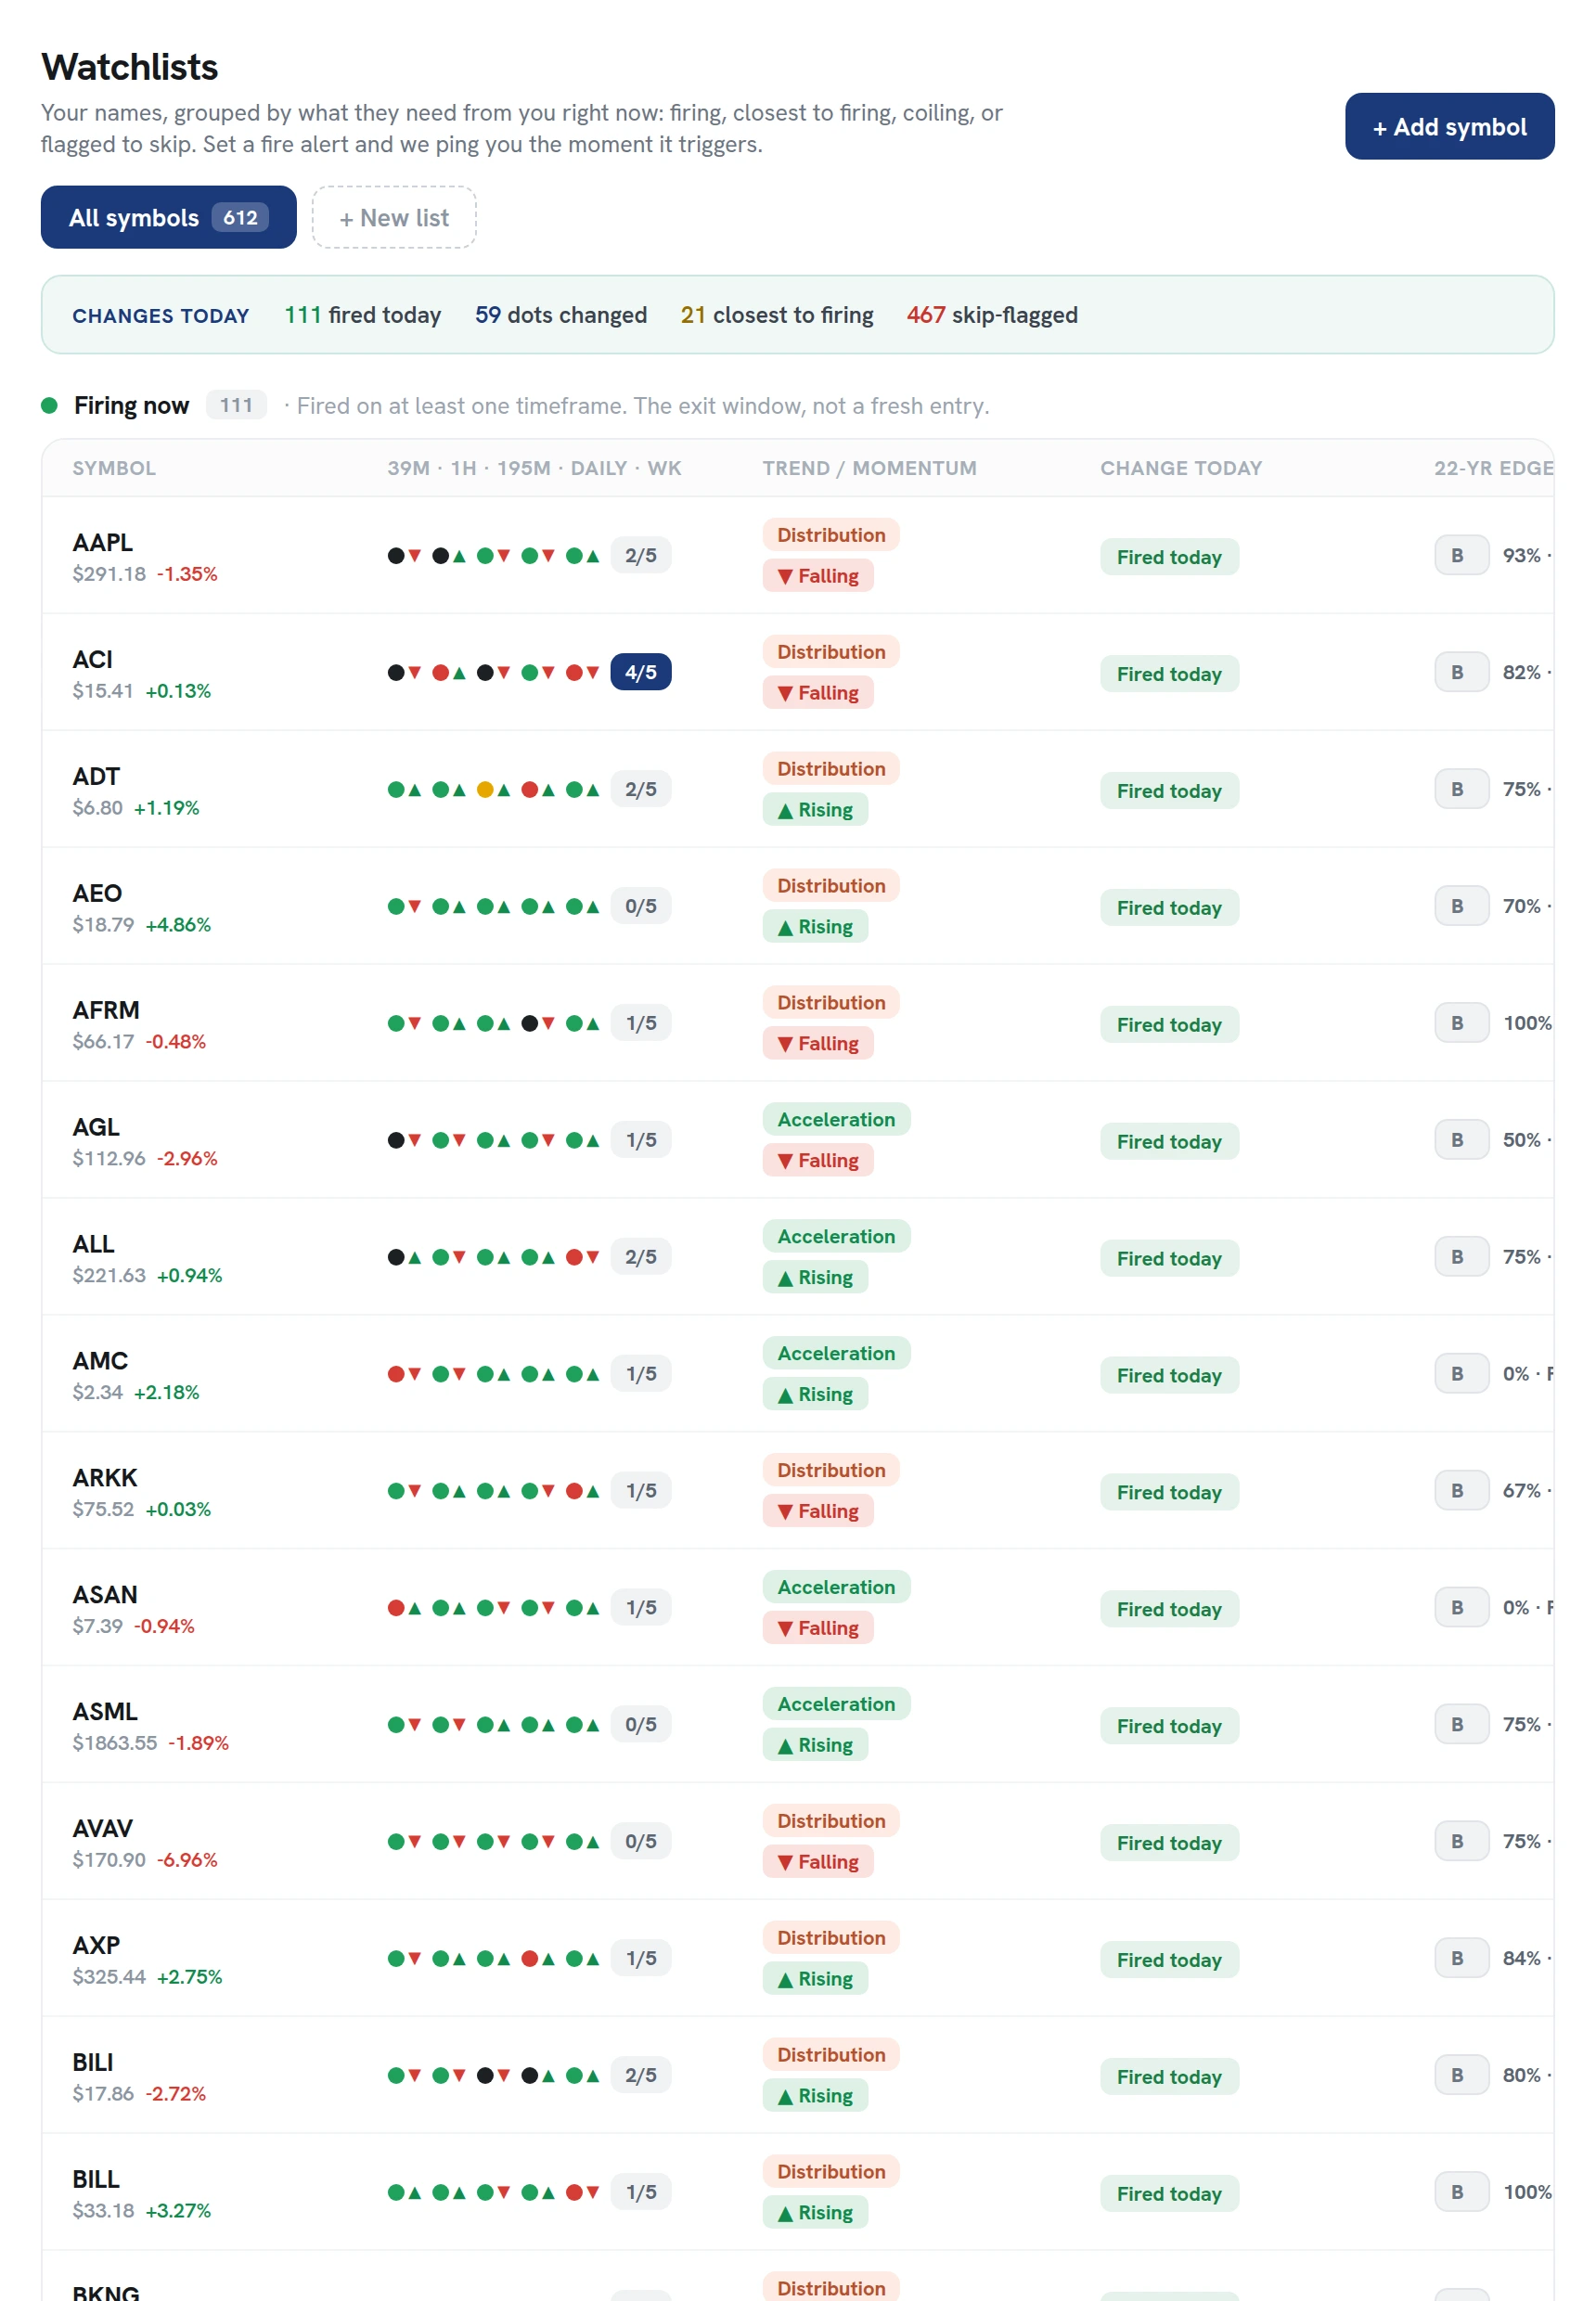
Alerts & Watchlists
Get notified when a setup triggers or fires, so you act without watching all day.
Learn more →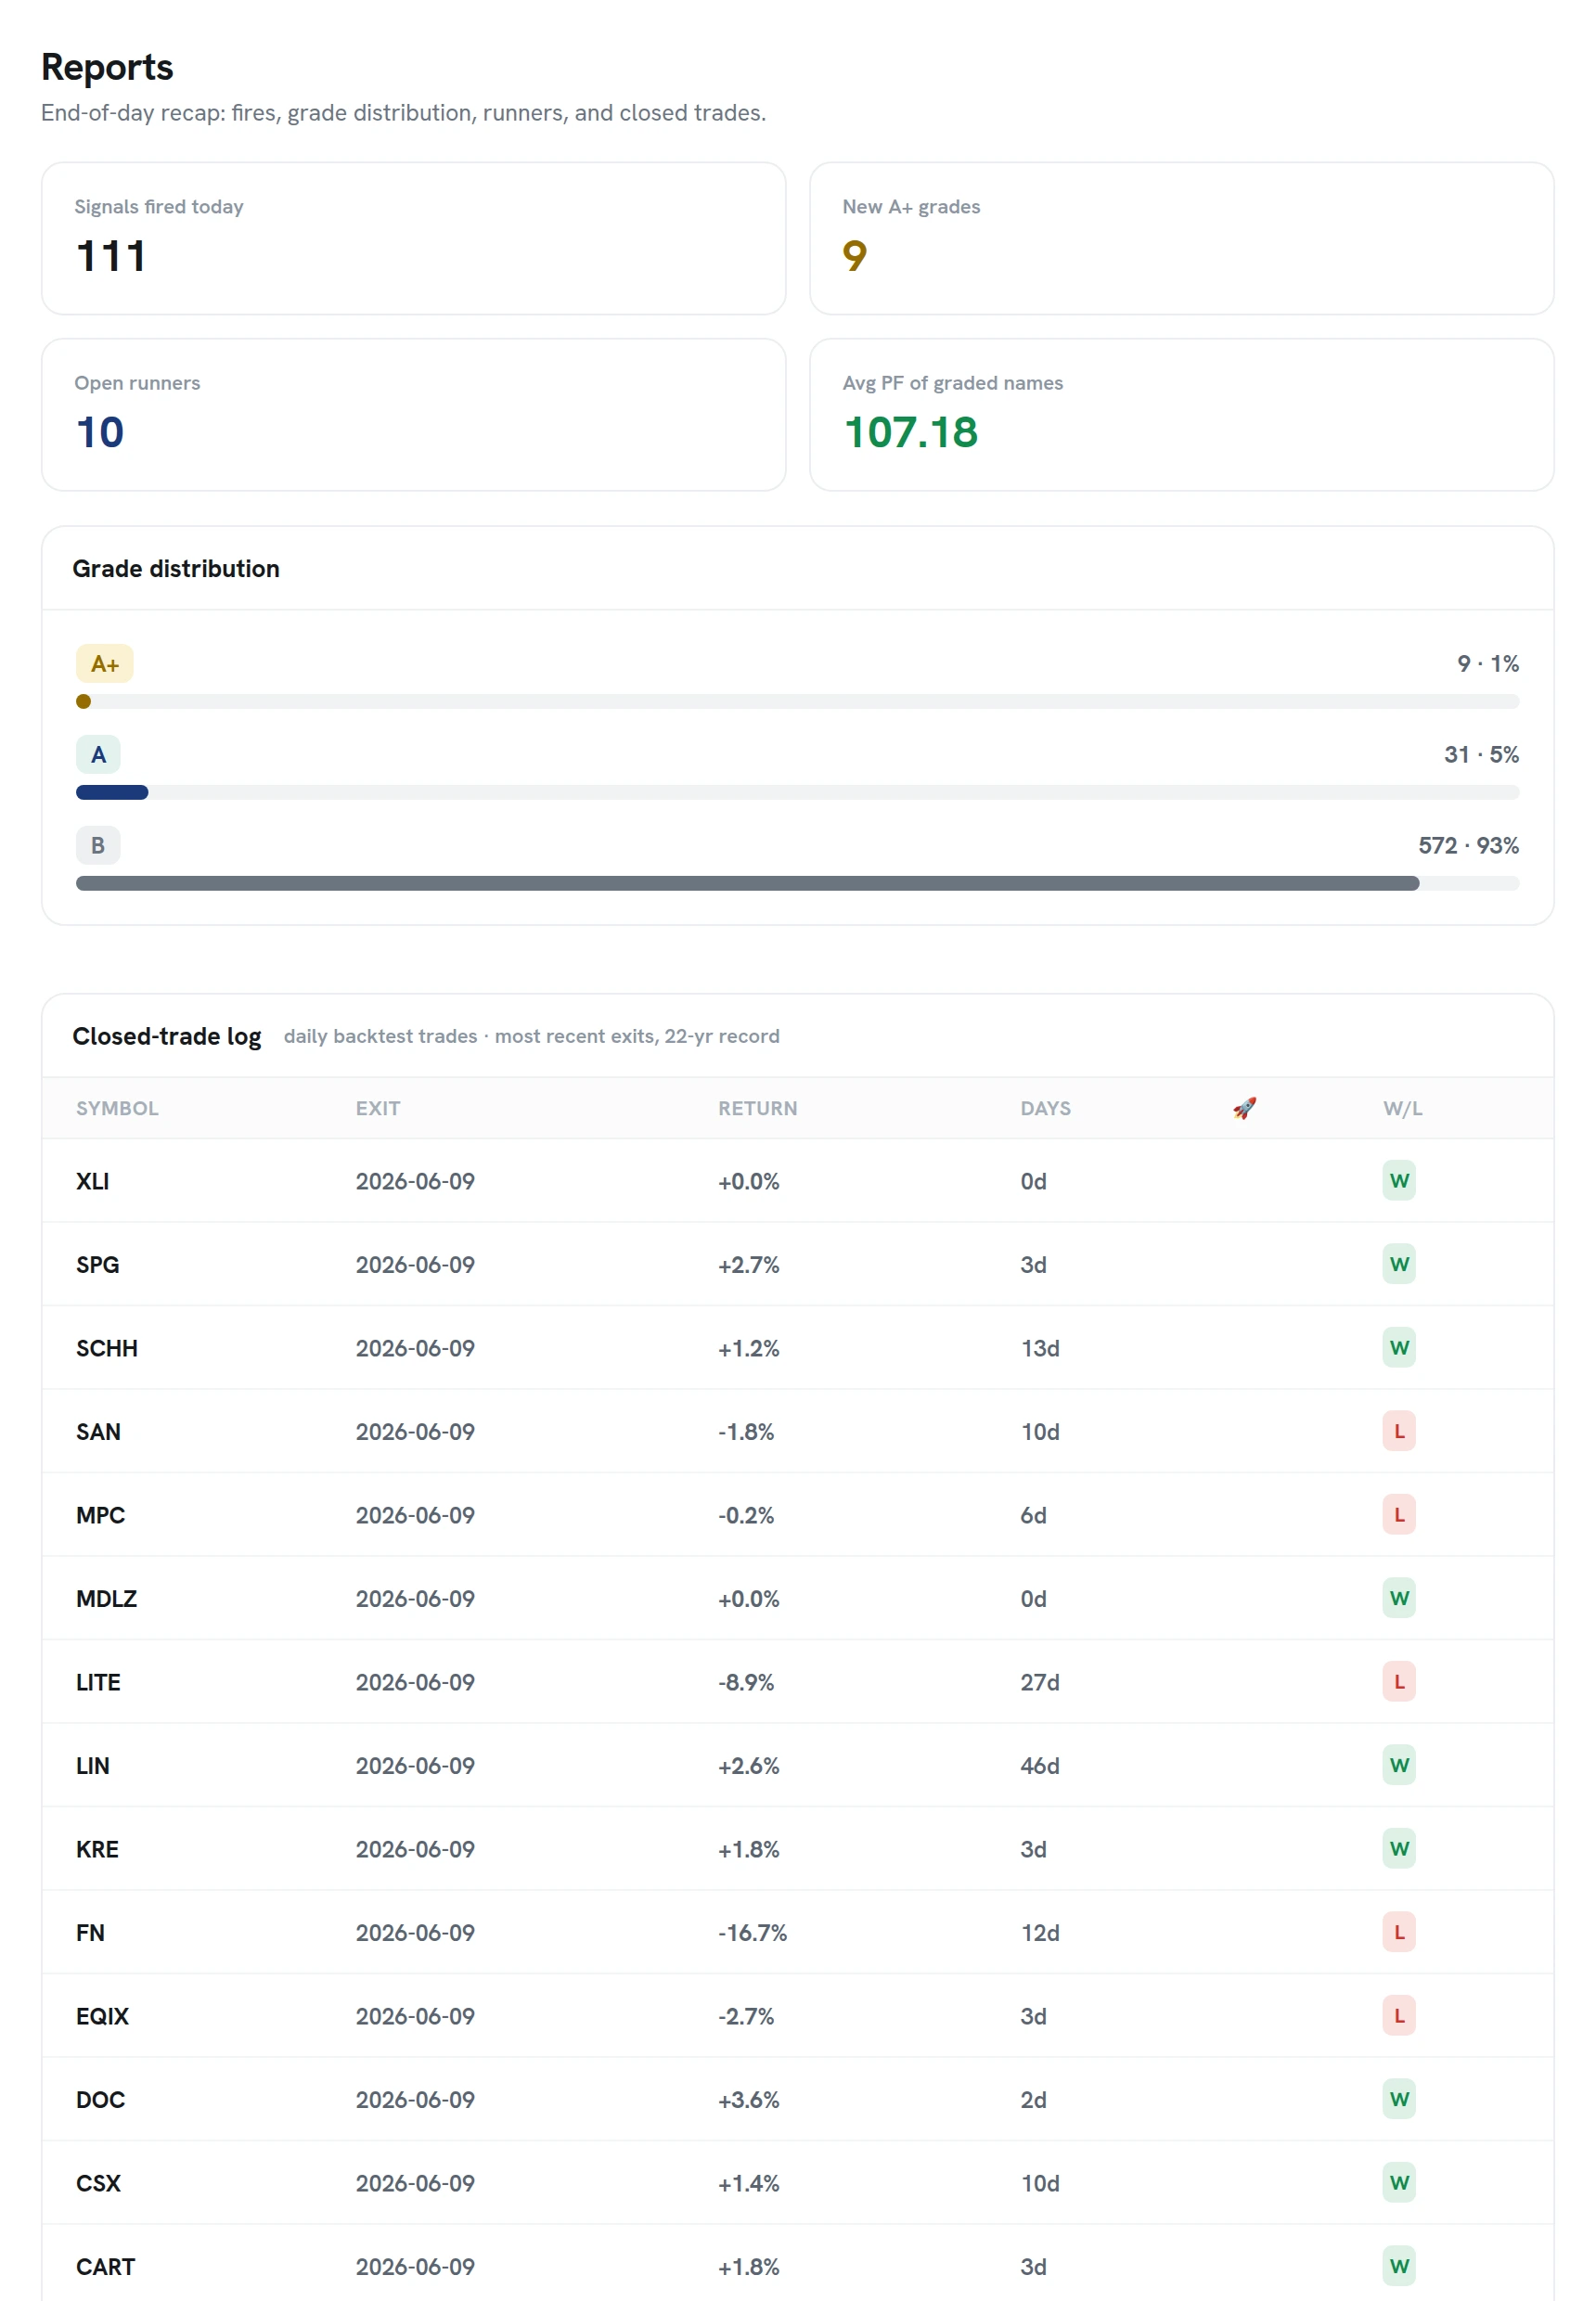
Reports
The closed-trade log across the universe: what fired, what worked, and what did not.
Learn more →One price, for the whole platform.
The board, the rankings, the 22-year backtester, the Morning Brief, and the alerts. One Squeeze Setups plan at $99 a month, also sold in the Bundle, which is everything we make except ETF Setups. Cancel anytime.
- The live Squeeze Board across 600+ stocks and ETFs
- Setups ranked by edge, confluence, and trend
- 22-year backtests on every symbol
- All 12 timeframes, 5-minute to weekly
- Morning Brief and alerts included
Frequently asked questions
What does Squeeze Setups actually do?+
It finds every active squeeze across 600+ stocks and ETFs and 12 timeframes, ranks each one by the 22-year backtest edge on the name, how many timeframes are squeezing together, and the trend, and shows you the full record behind every symbol. You get the few setups worth your attention, with the evidence attached.
How are setups ranked?+
By three things: the squeeze's own 22-year backtest edge on that name, how many timeframes are squeezing together, and whether the trend is stacked up. The per-symbol backtest is the edge behind the rank, not a forecast. We never claim a stock's history predicts its next trade.
Do I enter when the dots turn green?+
No, and this matters. The entry trigger happens inside the squeeze, while compression is still on. The fire (the green dots) marks the release of the move, which is where you take profits. It is the exit, not the entry.
What if the stock never gives me a pullback?+
That happens a lot. In our backtests, 46% of signals never pulled back even one ATR, and those runners won 92.3% of the time. That is why the playbook enters a starter on the trigger and adds on the pullback only if it comes.
Do the backtest numbers promise I will make money?+
No. Every number we publish comes from our own historical backtests and describes that sample, nothing more. Past performance does not guarantee future results, and Squeeze Setups is an educational research tool, not financial advice.
Can I cancel?+
Yes, from My Account at any time. You keep access until the period ends.
See today's setups, already ranked.
Stop staring at dots and wondering. The board has already done the homework on every squeeze across our 600+ stocks and ETFs.