Every screen between a squeeze and a decision.
The platform takes you from "compression exists somewhere" to "this setup, this edge, this evidence" in a few clicks. Here is the tour, screen by screen.
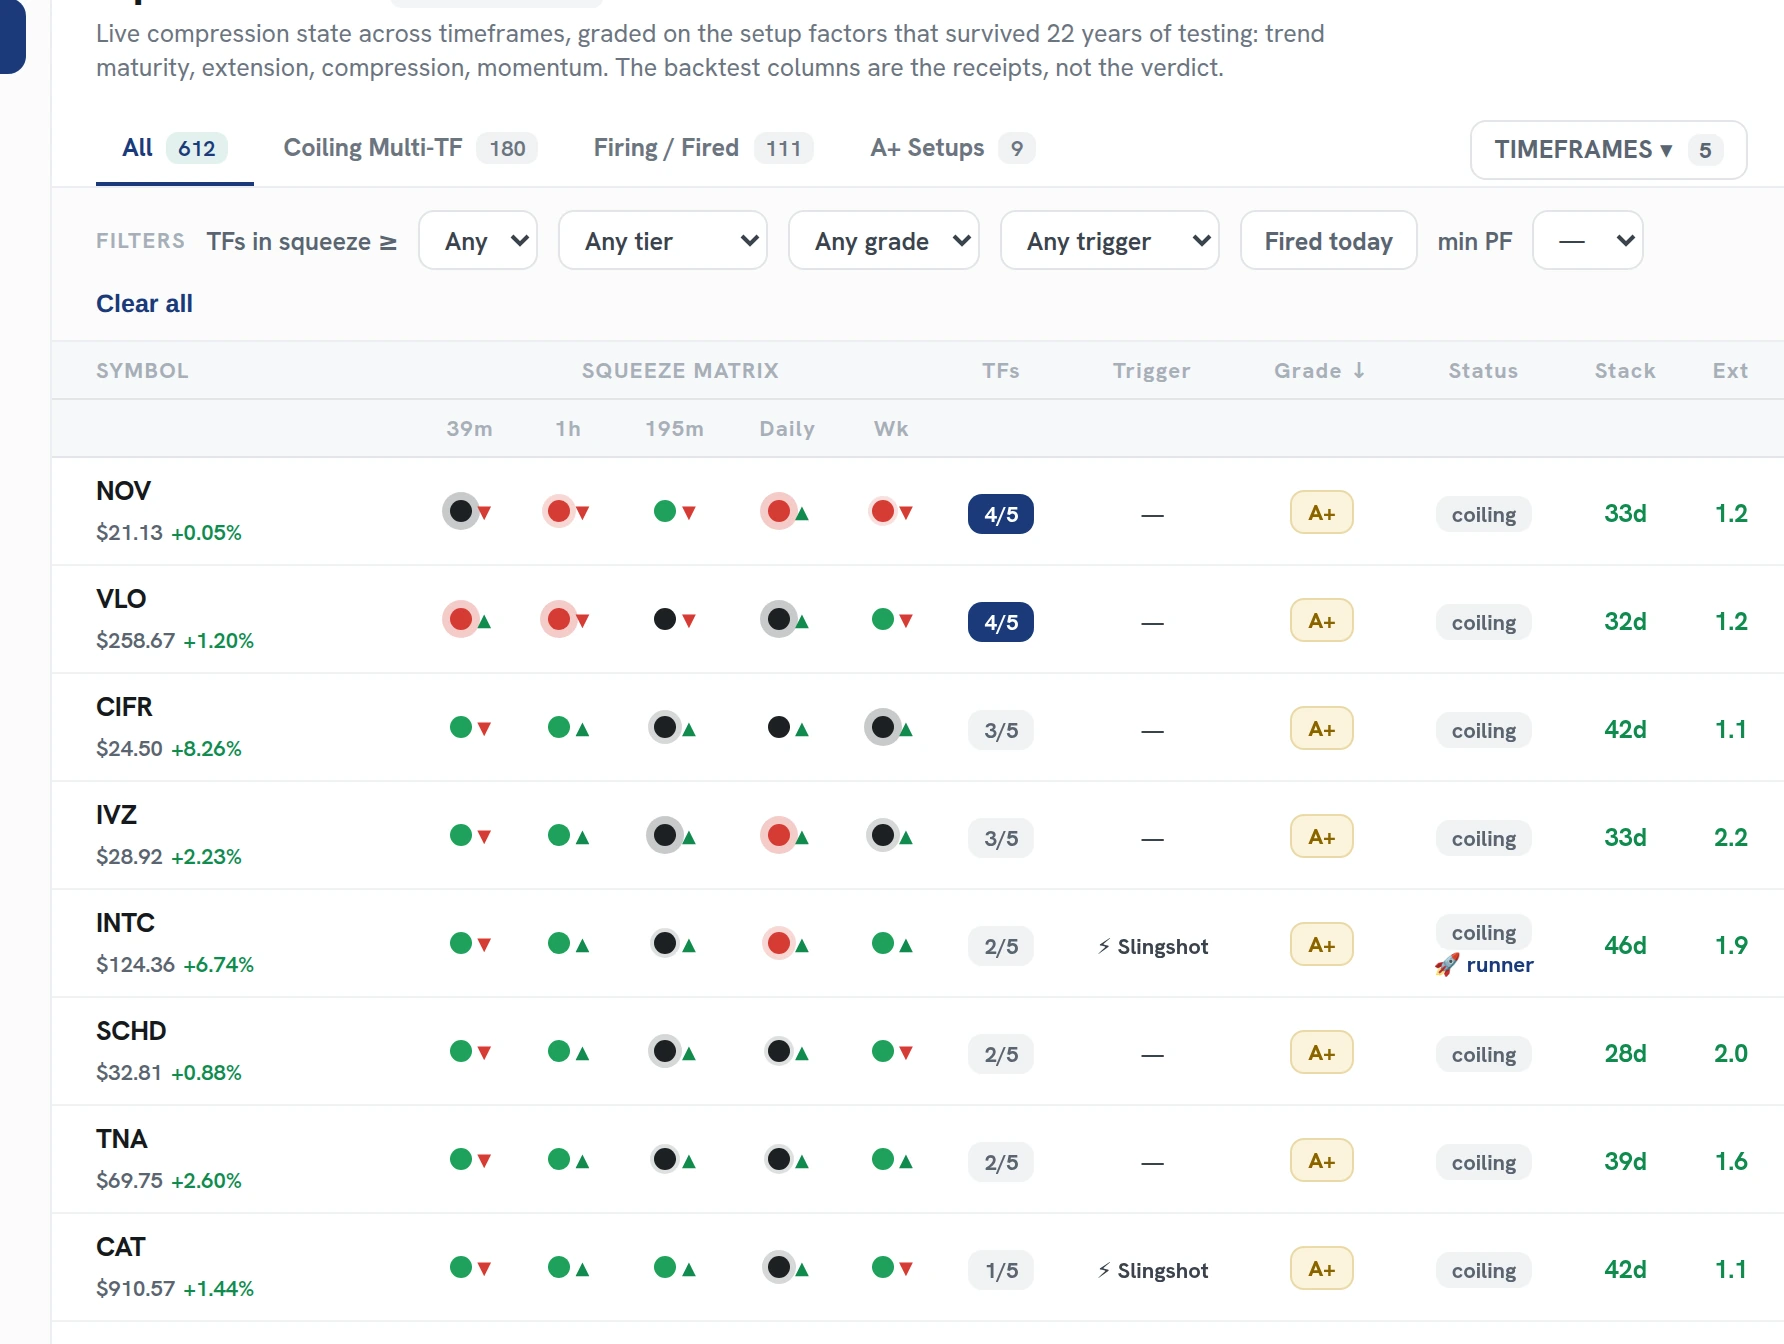
The Squeeze Board, your home screen.
Every active squeeze across our 600+ stocks and ETFs on one matrix: symbols down the side, all 12 timeframes across the top. Each cell shows the squeeze state, and the board ranks by the backtest edge on each name, how many timeframes are squeezing together, and the trend.
Filters and presets cut the matrix down to what you care about: only positive-edge setups, only daily and weekly, only your watchlist.
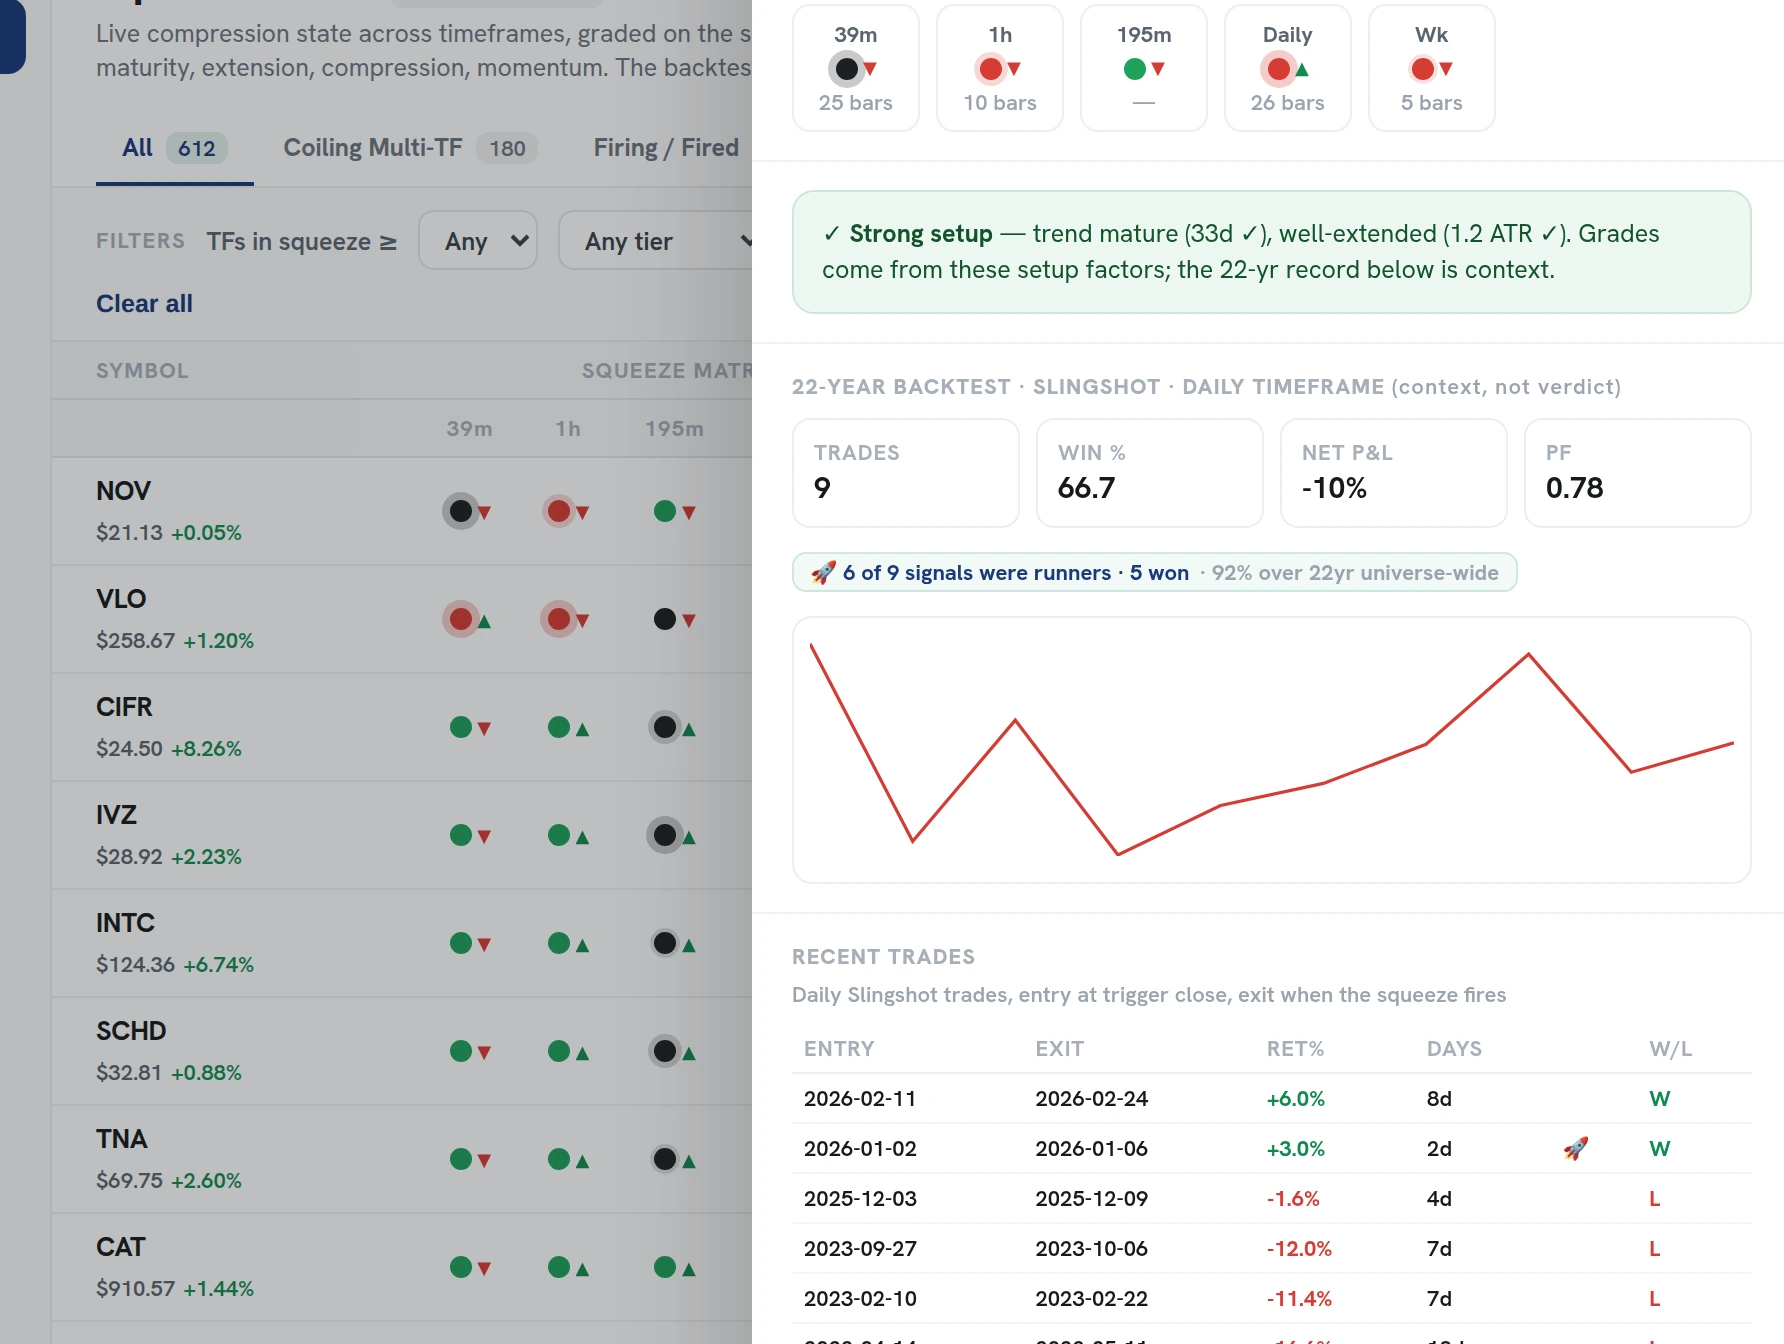
The drill-down, where the setup explains itself.
Click any cell and you get the full read on that setup: the three signals, which line up and which do not, and what would strengthen it. The read always leads.
Below it sits the symbol's 22-year record, labeled exactly what it is: the receipts behind the rank, not a forecast. The trade log and equity curve let you check the work.
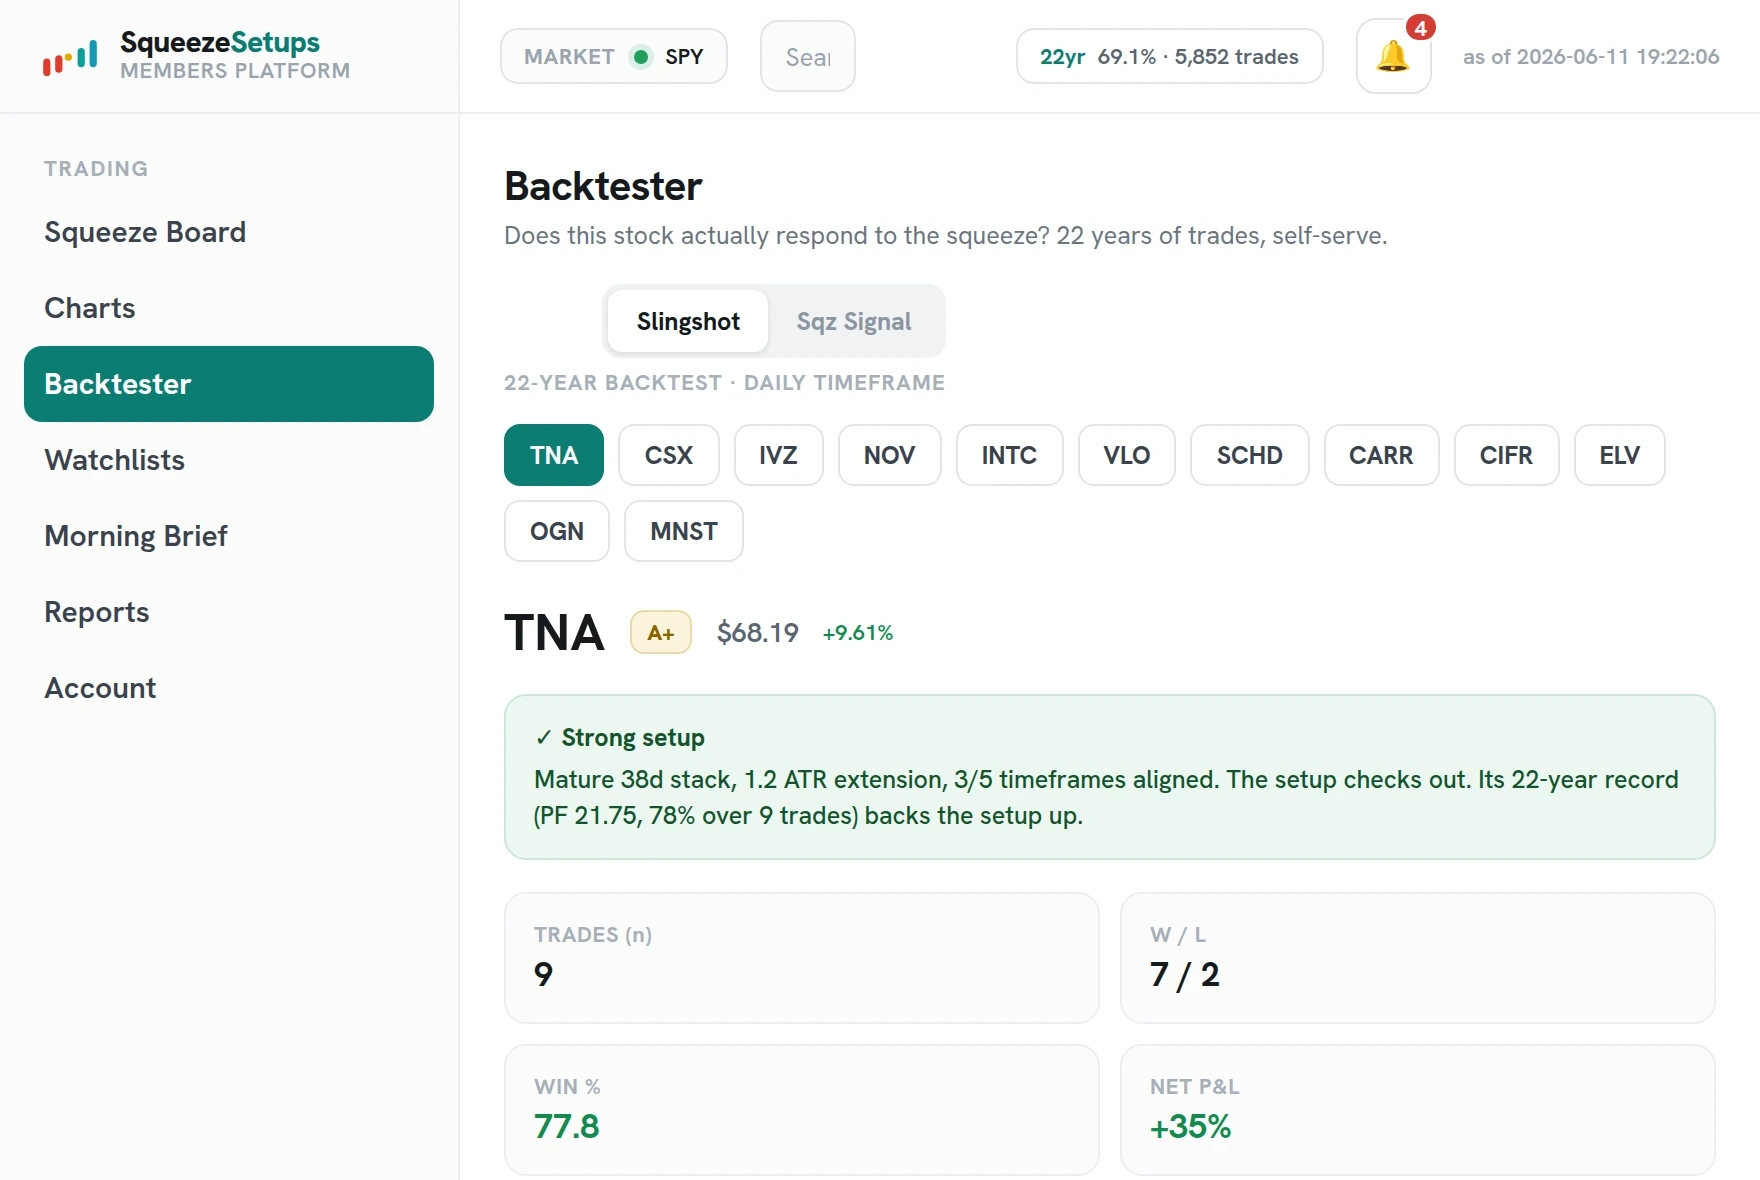
The backtester, 22 years deep.
Pick any symbol and any timeframe and see how the setups behaved from 2004 to today, trade by trade. Wins, losses, flat stretches, and drawdowns, all in the open.
- 6,556 daily Slingshot trades in the full sample, 2004 to 2026.
- 68.3% win rate in our backtests, 67% to 71% from 2004 to 2021, 61% since 2022.
- About 13 days average hold, so you know the rhythm before you take a trade.
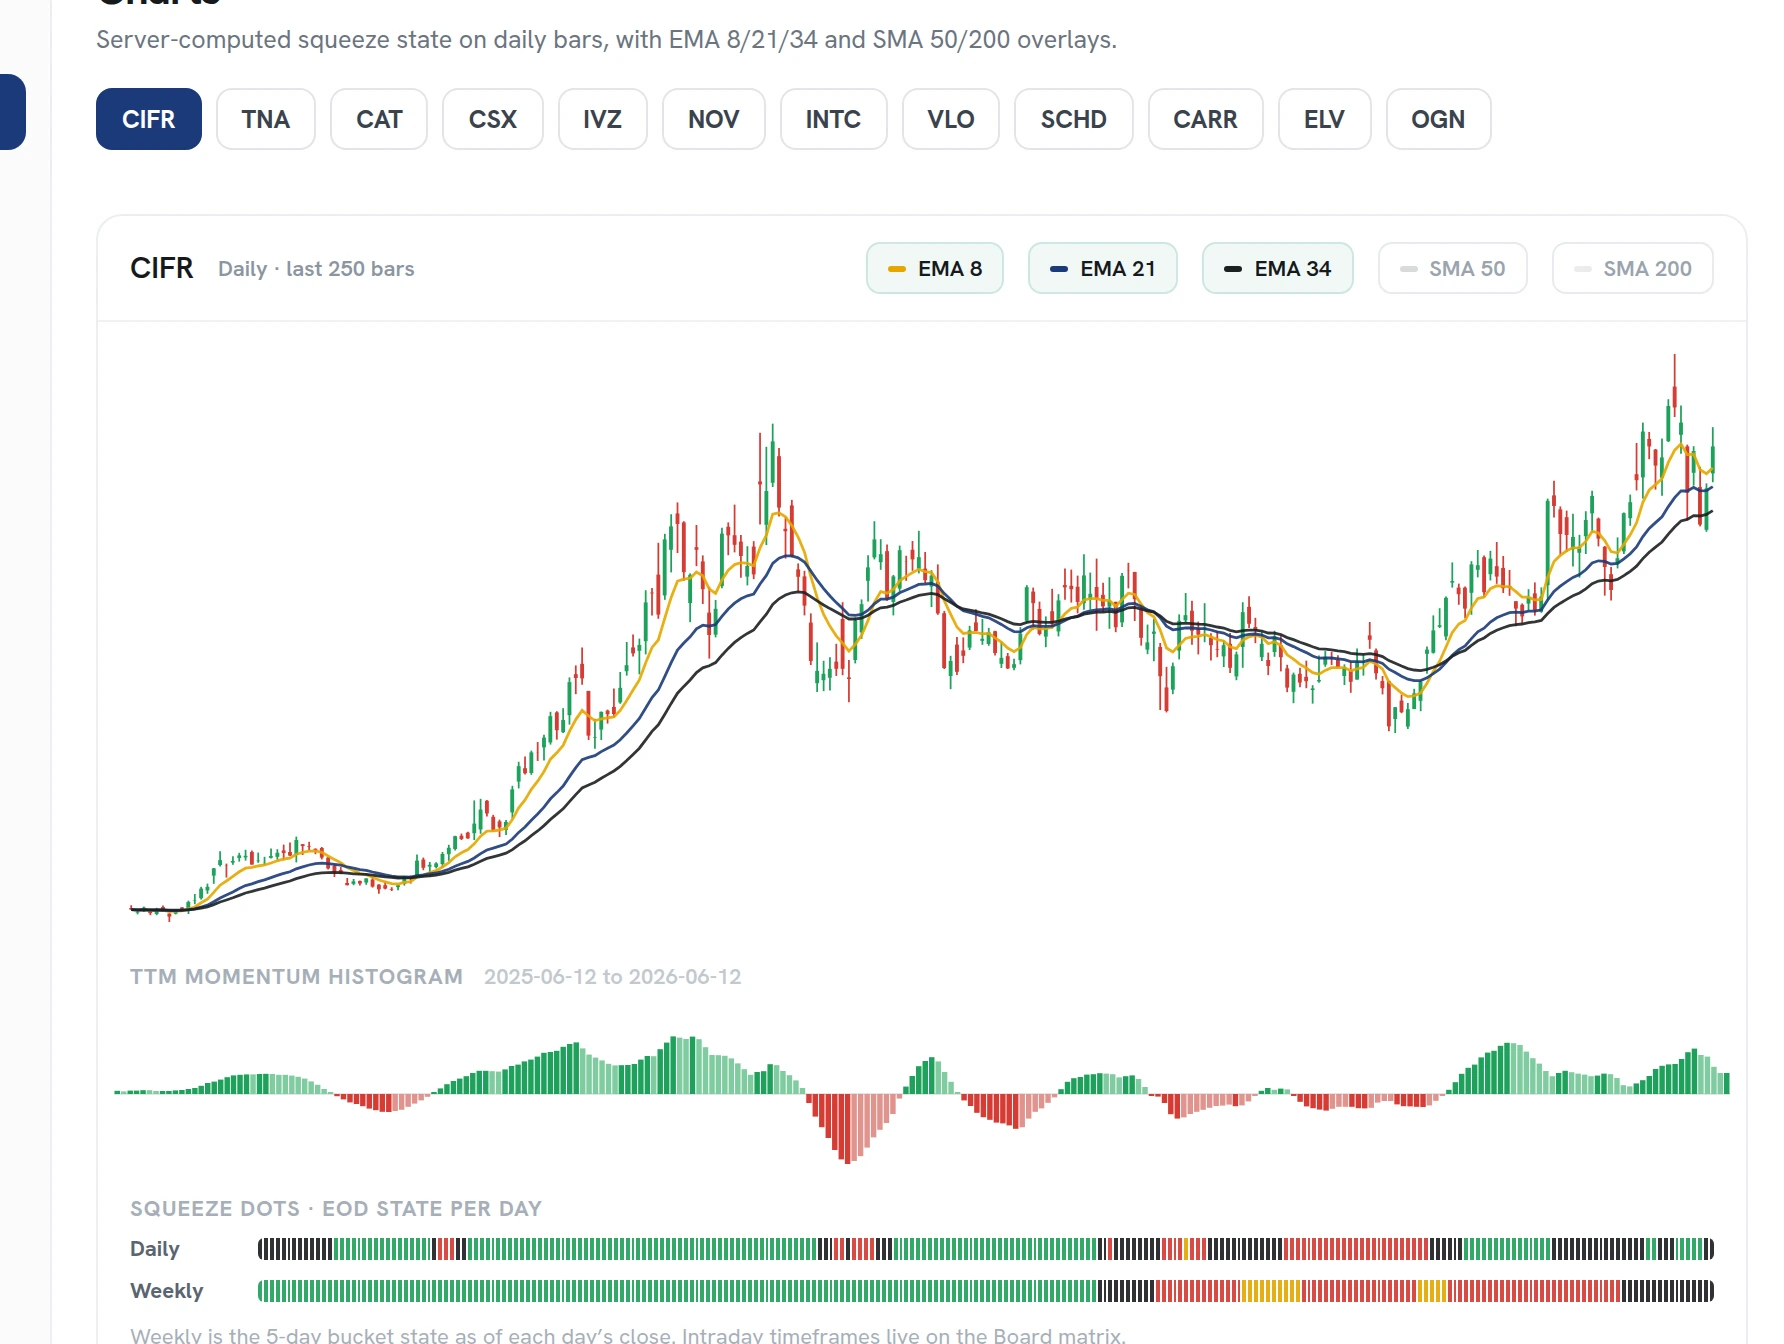
Charts, with the setup on them.
Open any symbol from the board and the chart carries the squeeze story with it: the compression, the trigger, and the fire, on the same price action you would chart yourself. No re-plotting in another tool.
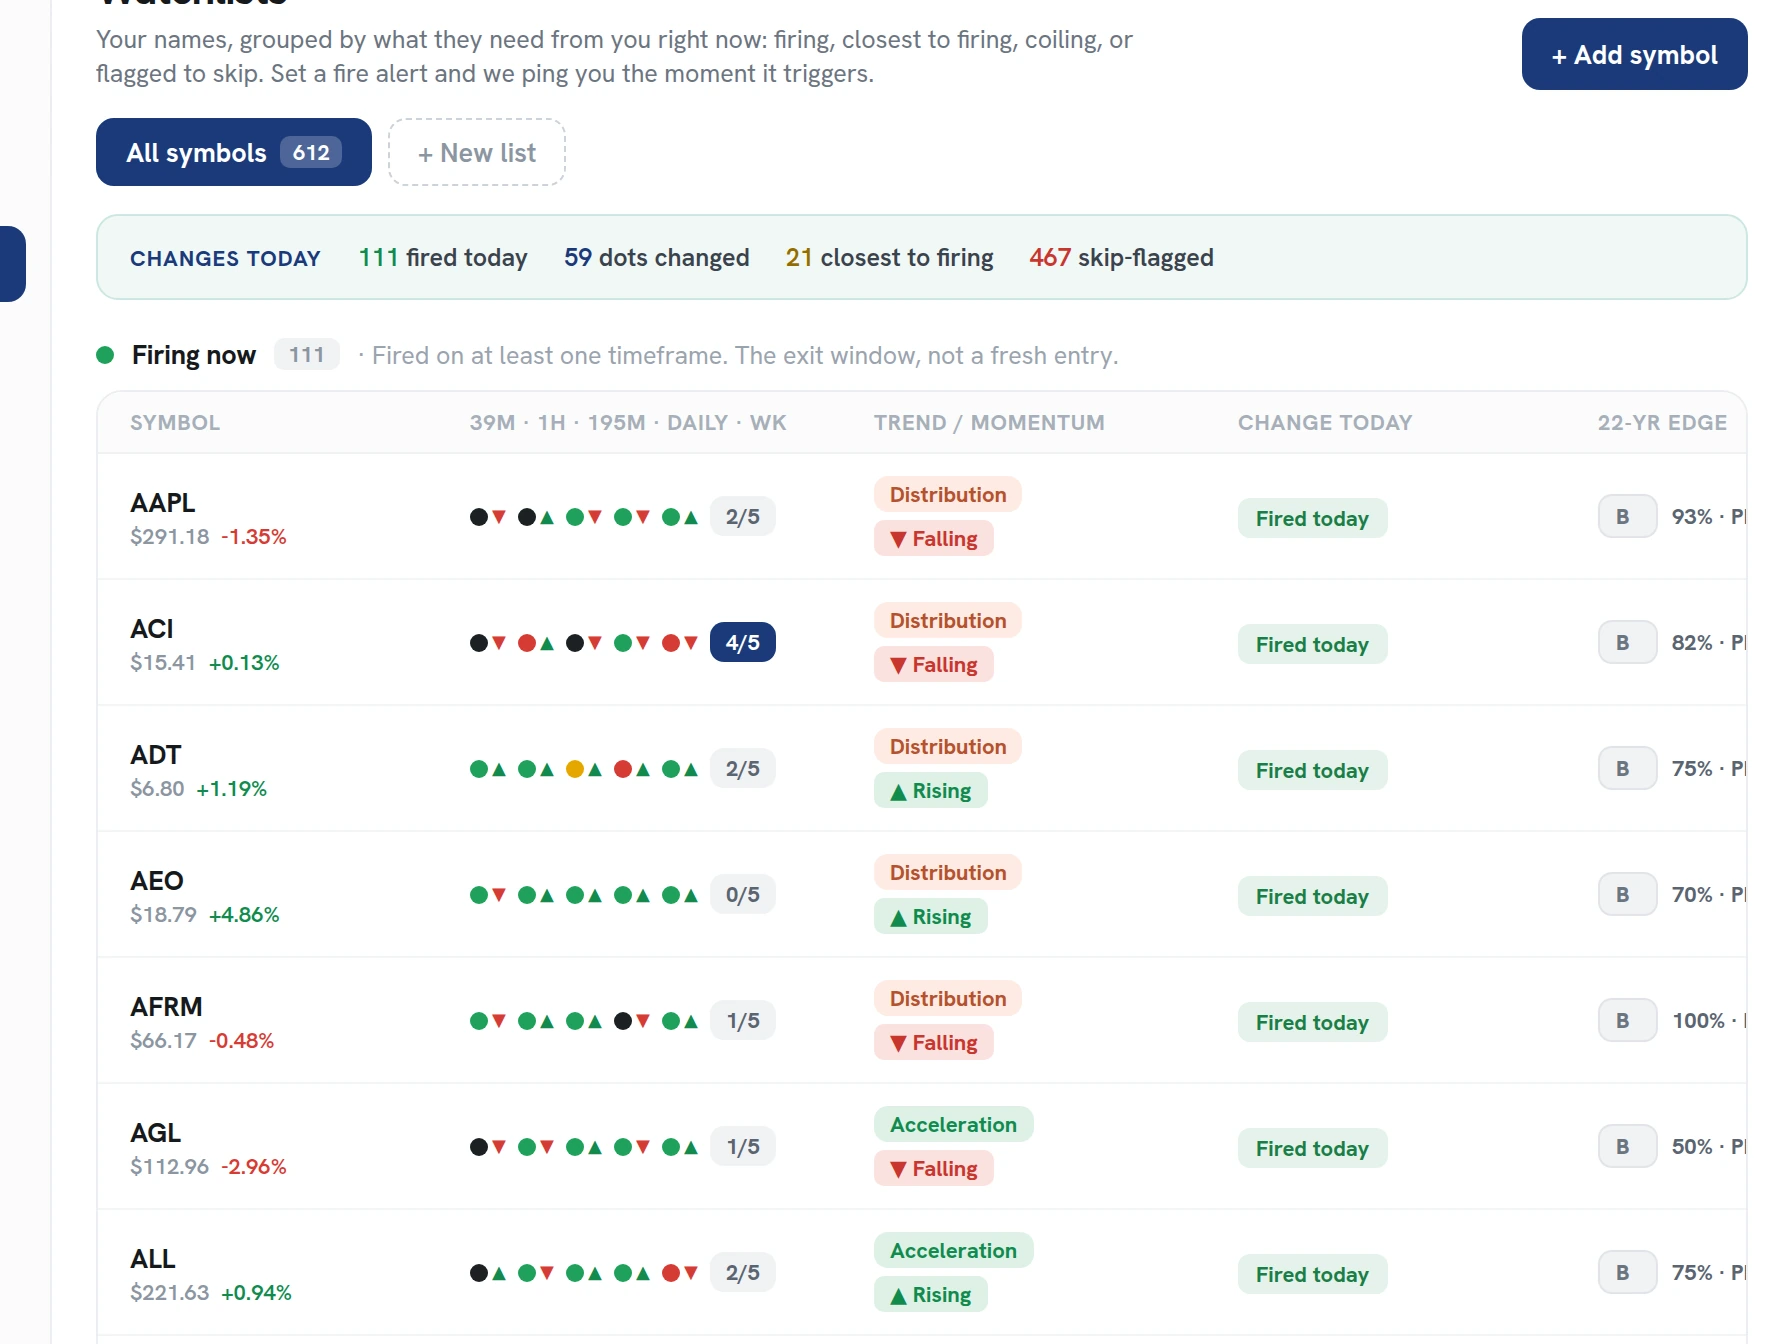
Watchlists, grouped by state.
Your symbols, organized the way the trade actually unfolds: which ones just fired, which are closest to firing, and which are still in a squeeze. No re-scanning, no spreadsheet on the side.
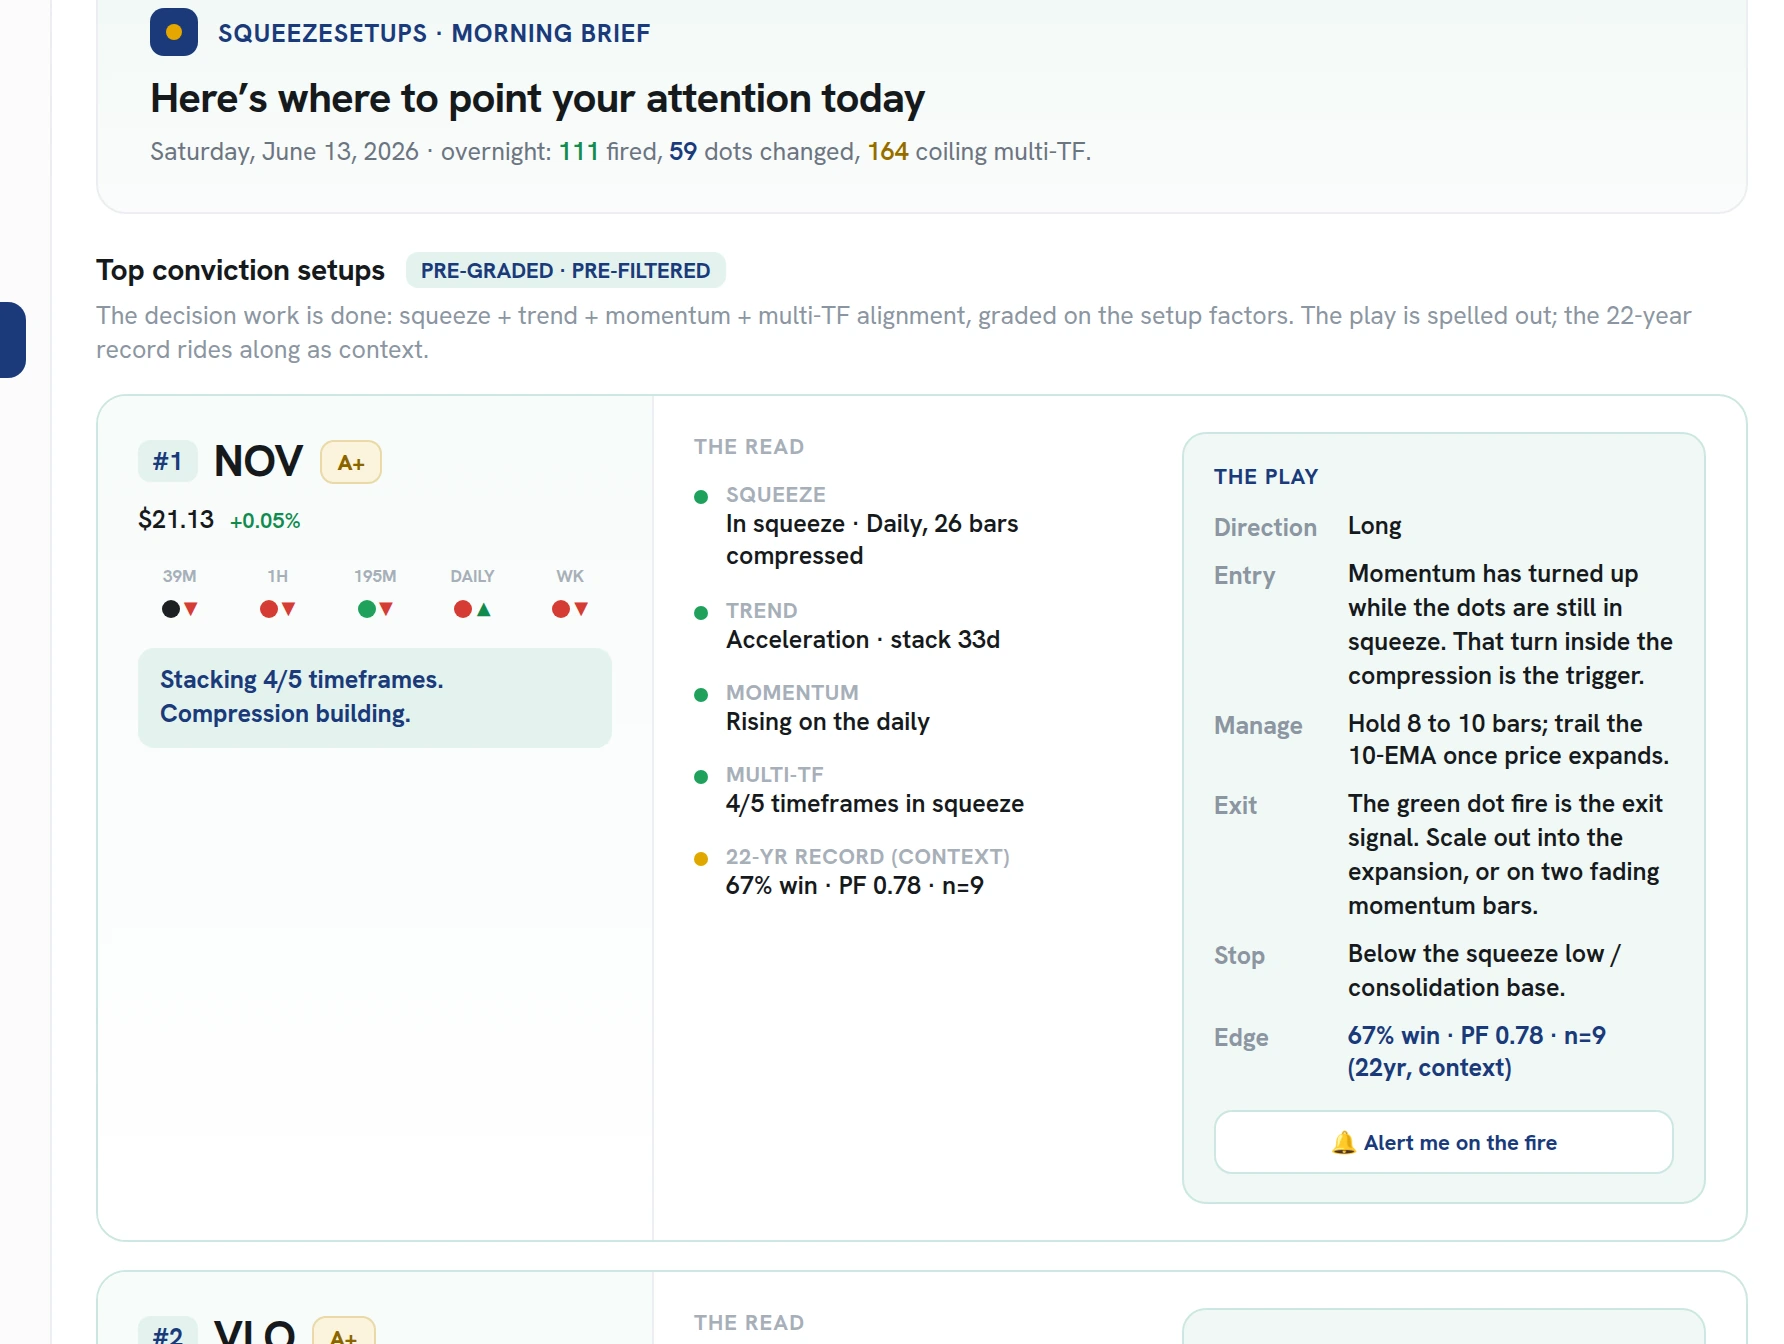
The Morning Brief, before the open.
One page each morning: the setups firing a signal, the ones building across timeframes, and what changed overnight. Five minutes of reading instead of an hour of scanning.
Alerts, so the board watches for you.
Get notified when a setup triggers or when a squeeze fires. You set the timeframes and what counts as worth an alert, then go live your life.
See today's setups, already ranked.
The board has done the homework on every squeeze across our 600+ stocks and ETFs. Come read the short list.