22 years of receipts behind every symbol.
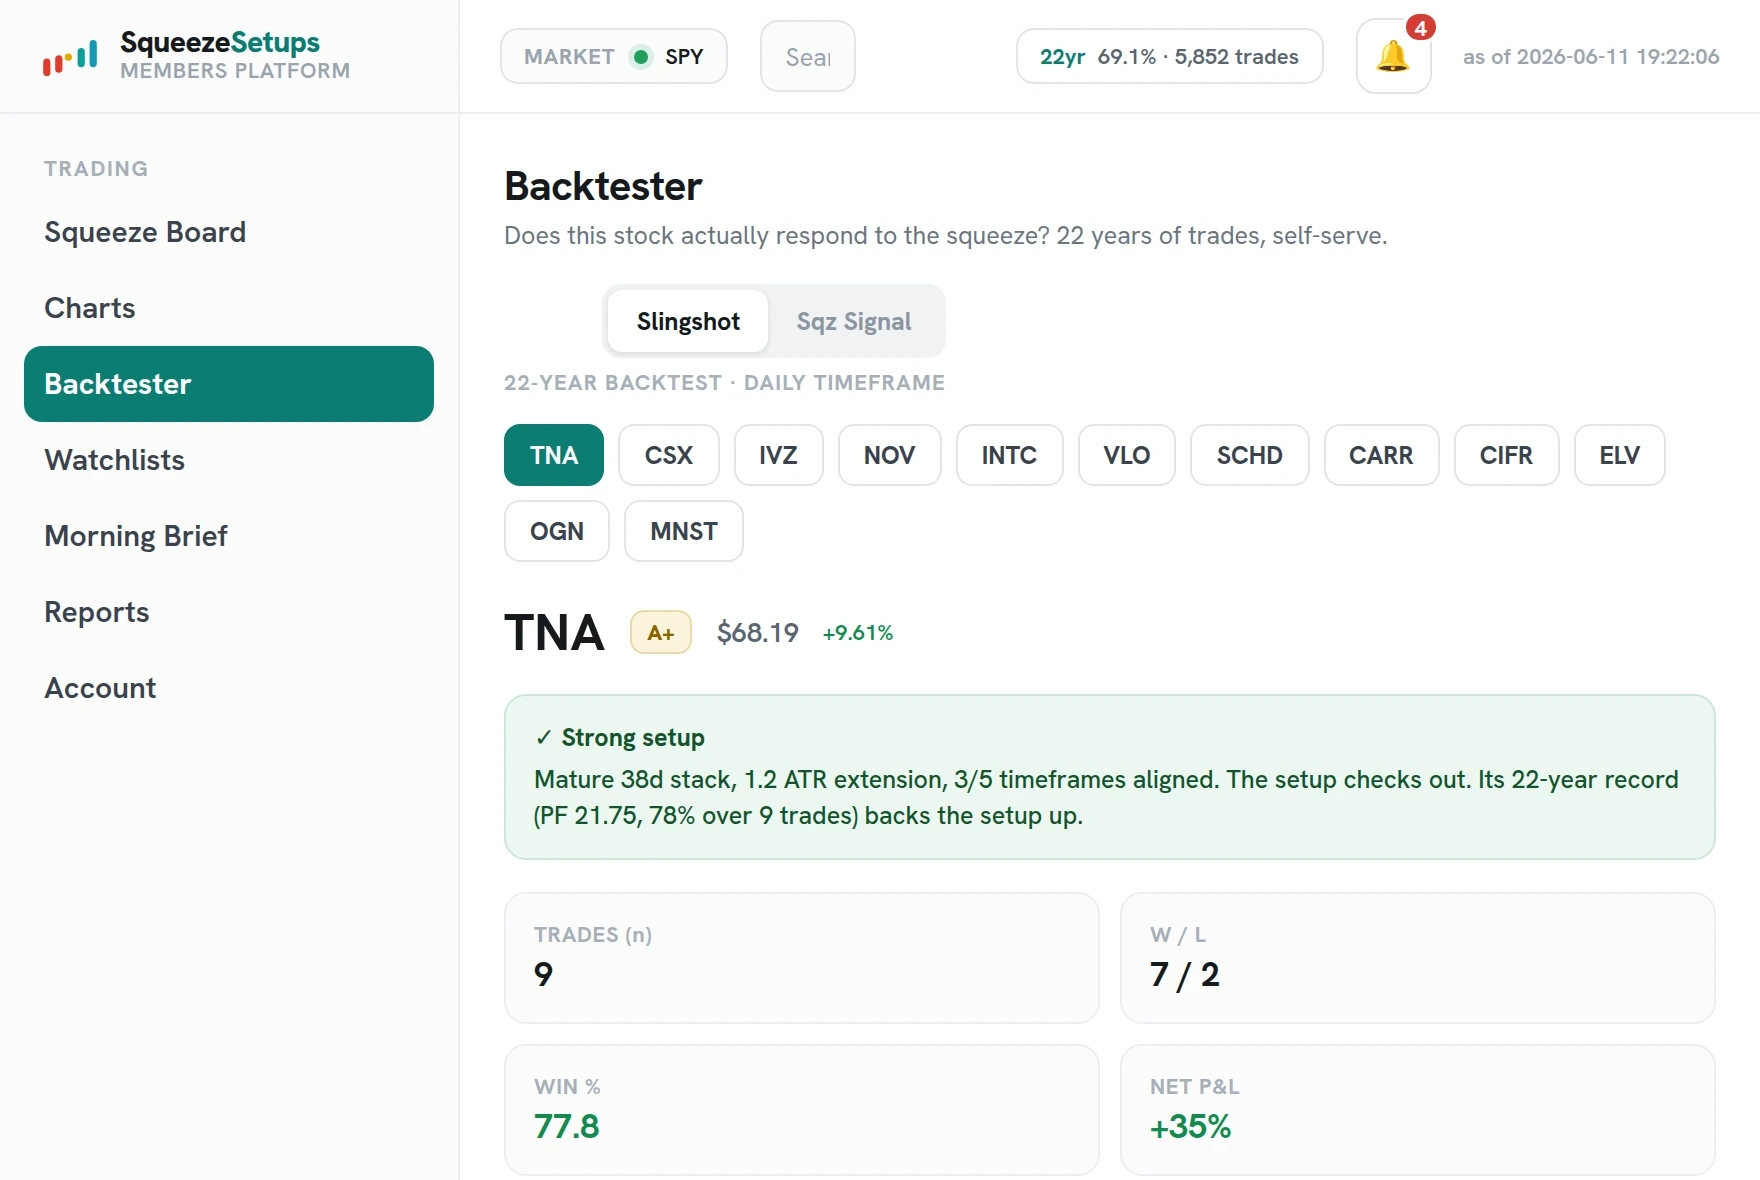
The backtester holds the full historical record of these setups on every stock we cover, 2004 to today, trade by trade. It is the evidence behind the approach, laid out so you can check it yourself.
The whole record, not the highlight reel.
Pick a symbol and a timeframe and the backtester lays out everything the setups did there across 22 years. The good stretches, the rough ones, and the boring ones in between.
Every trade, listed
Entry, exit, result, and hold time for each historical trade. About 13 days average hold across the sample, so you know the rhythm.
The ride, drawn out
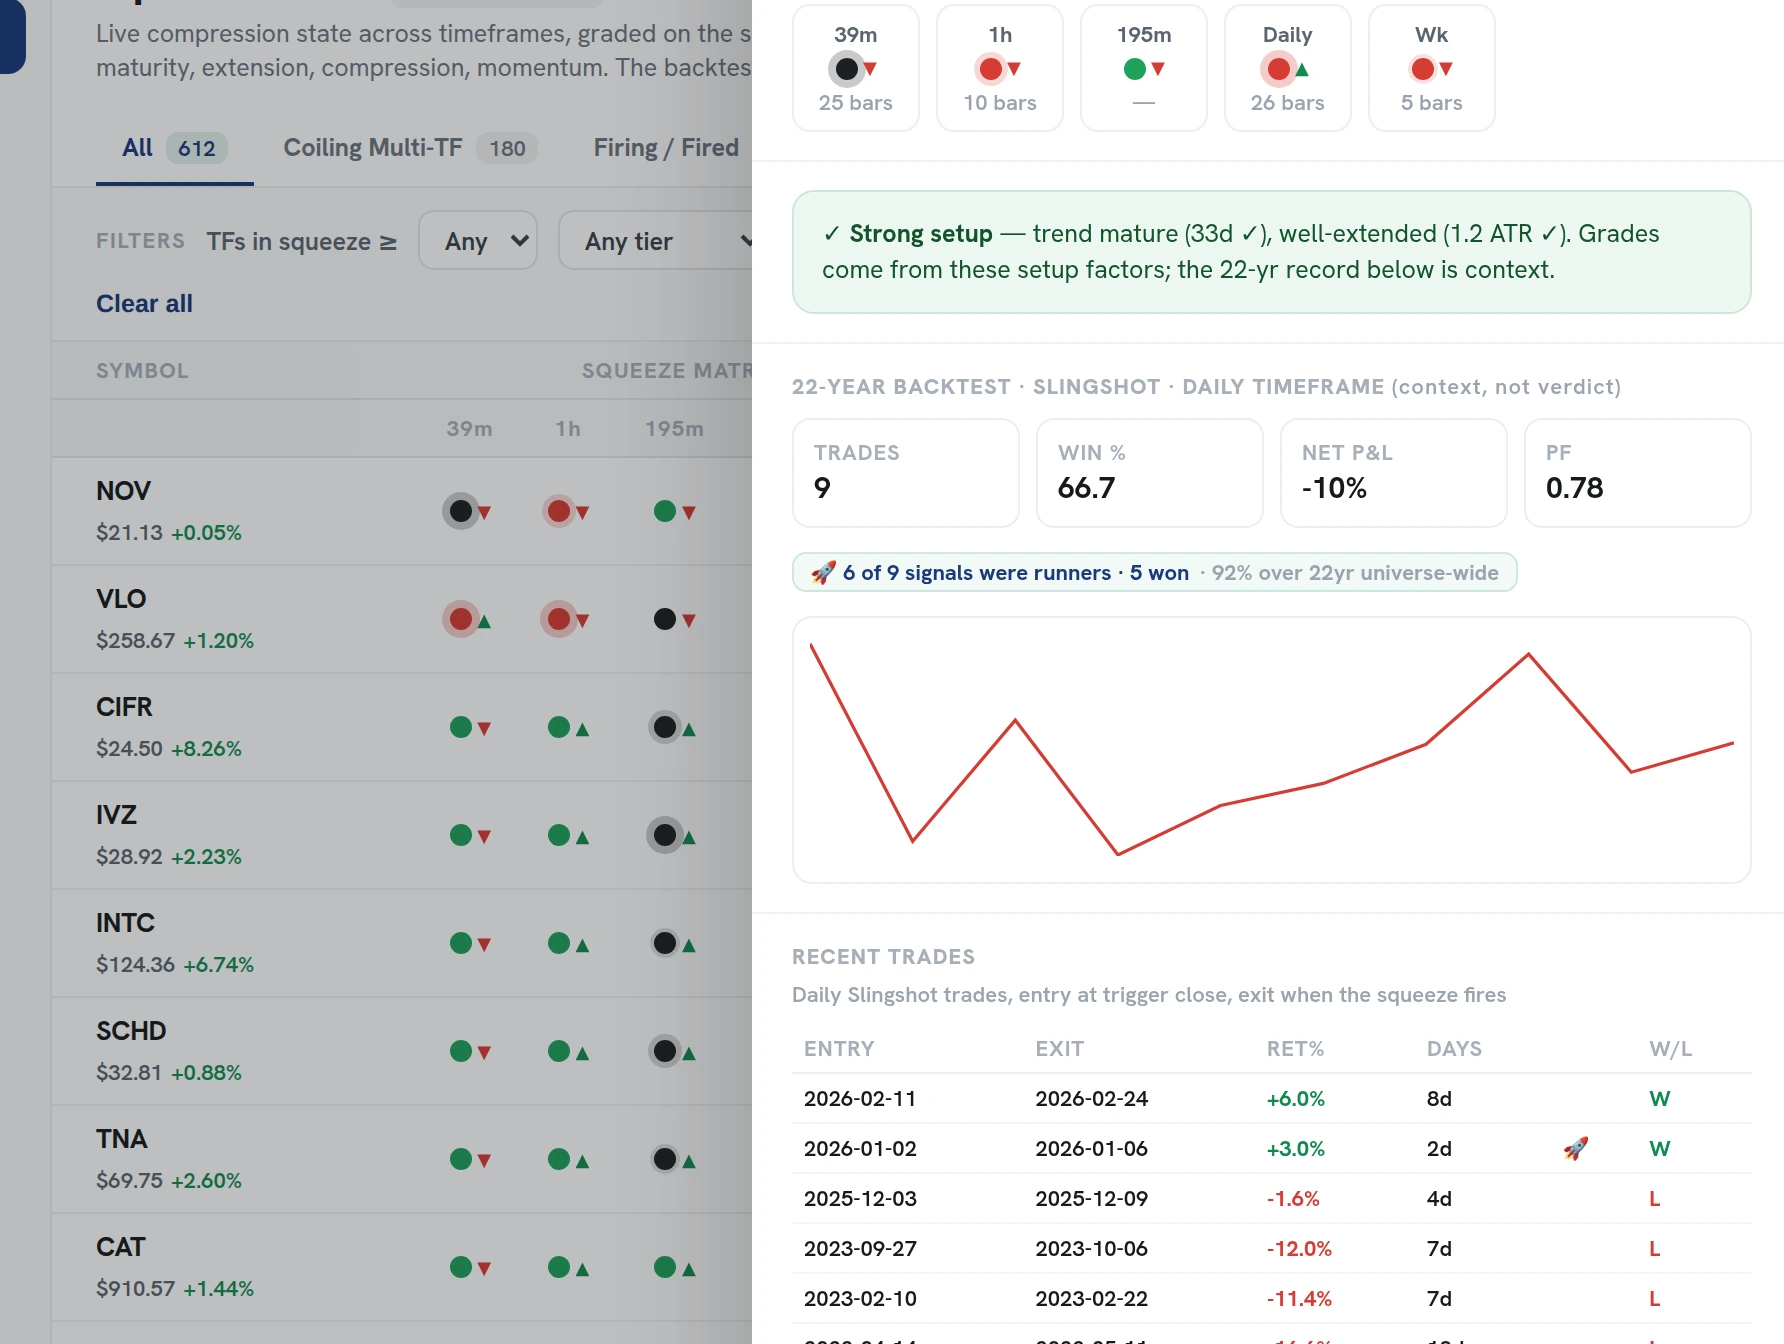
The cumulative curve including every drawdown and flat stretch. You see what holding the approach actually felt like.
Broken out by era
In our backtests the win rate held between 67% and 71% in every era since 2004, through crashes and bull runs alike.
The pullback truth
46% of signals in our sample never pulled back 1 ATR, and those won 92.3%. The per-symbol view shows you that split too.
The edge, not a forecast.
The backtester shows whether the squeeze has carried an edge on a name across 22 years, and the board ranks by it: a name the setup has never paid on does not belong at the top of your list.
What the record will never be is a prediction. No backtest tells you what the next trade does, and we never present one as if it does. It shows the approach has been tested honestly on the name you are looking at, and it lets you check our work. That is its whole job.
Honest accounting, by design.
Backtests are easy to flatter. Ours are built to be checked instead.
- No cropped windows. The record runs 2004 to today, including the years that hurt.
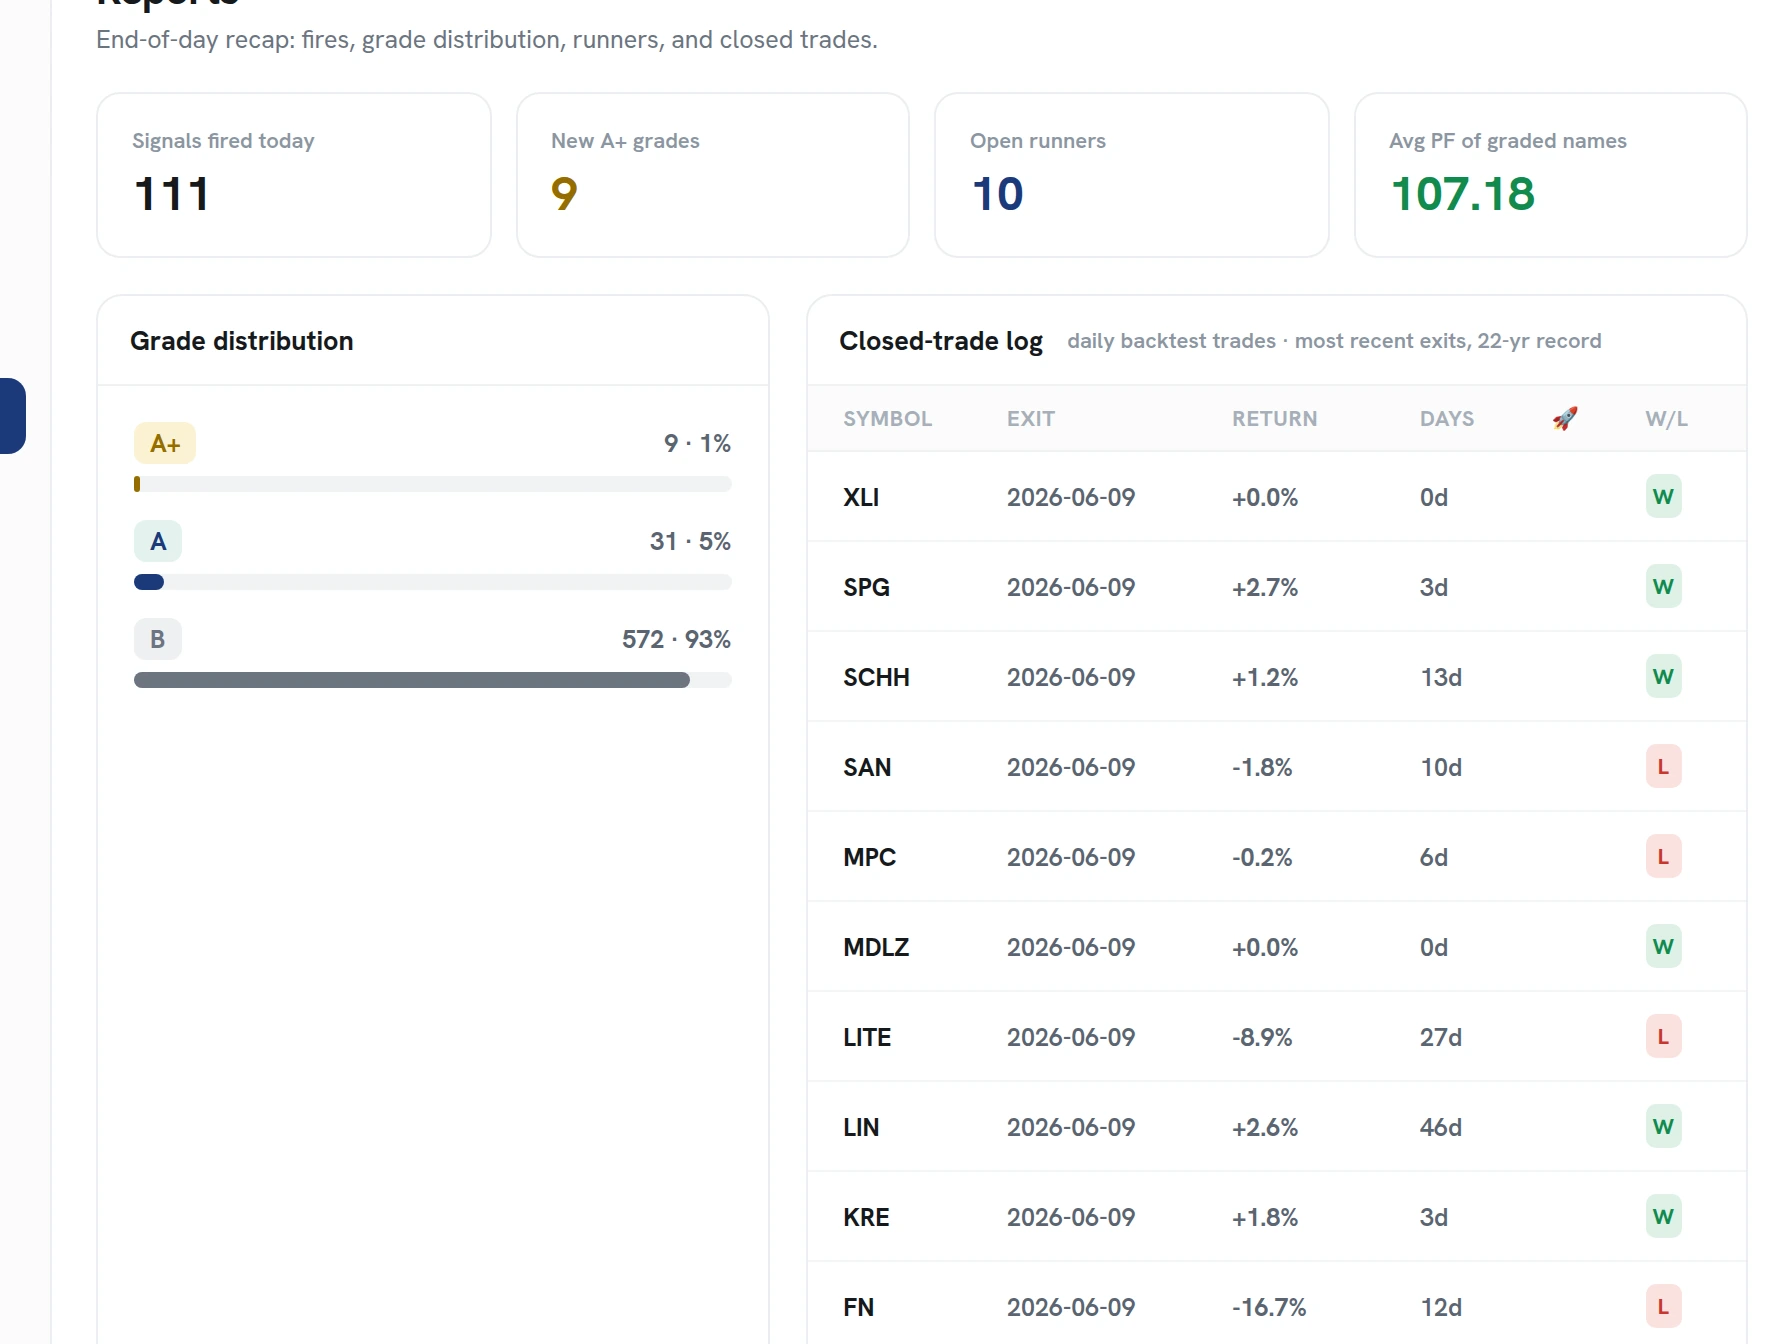
- Losses on the page. Every losing trade sits in the same log as the winners.
- Sample-only claims. Every number describes our backtests, never a promise about the future.
Conviction comes from checked work.
It is easier to follow a playbook through a losing streak when you have seen 22 years of its wins and losses laid out. That is what the backtester is for.
Verify before you trust
Open the record on any symbol and check the approach yourself before you put weight on a single setup.
Know the rhythm
Average holds, typical drawdowns, and era-by-era results tell you what normal looks like before you live through it.
Keep perspective
When a trade loses, the long record shows you whether anything is actually broken or it is just variance.
Open the receipts on any symbol.
22 years, 5,852 trades, nothing cropped. Check our work, then use it.