Power Features: Timeframes, Symbol Sync, and Dark Mode
Goal: Tailor the workspace to how you scan: pick which timeframe columns appear, keep one symbol in focus as you move between views, and switch the theme.
You need: A Squeeze Setups account ($99/mo) and any view open: the Squeeze Board, Charts, or the Backtester.
These three features do not change the research. They change how much of it you see at once and how quickly you can move through it. Use the Timeframes picker to trim the matrix to the timeframes you actually trade, use symbol sync so the name you are studying follows you from the board into Charts and the Backtester, and use Dark Mode if you stare at the board all session. Each is a one-click control. Here is where to find them and what they do.
How do I choose which timeframe columns show?
The Squeeze Matrix on the board shows one dot per timeframe, and by default it shows a lot of them, from 5m up through daily. If you only trade the daily Slingshot Squeeze, the intraday columns are noise. The Timeframes picker, in the filter row above the board, lets you turn columns on and off so the matrix only renders the timeframes you care about.
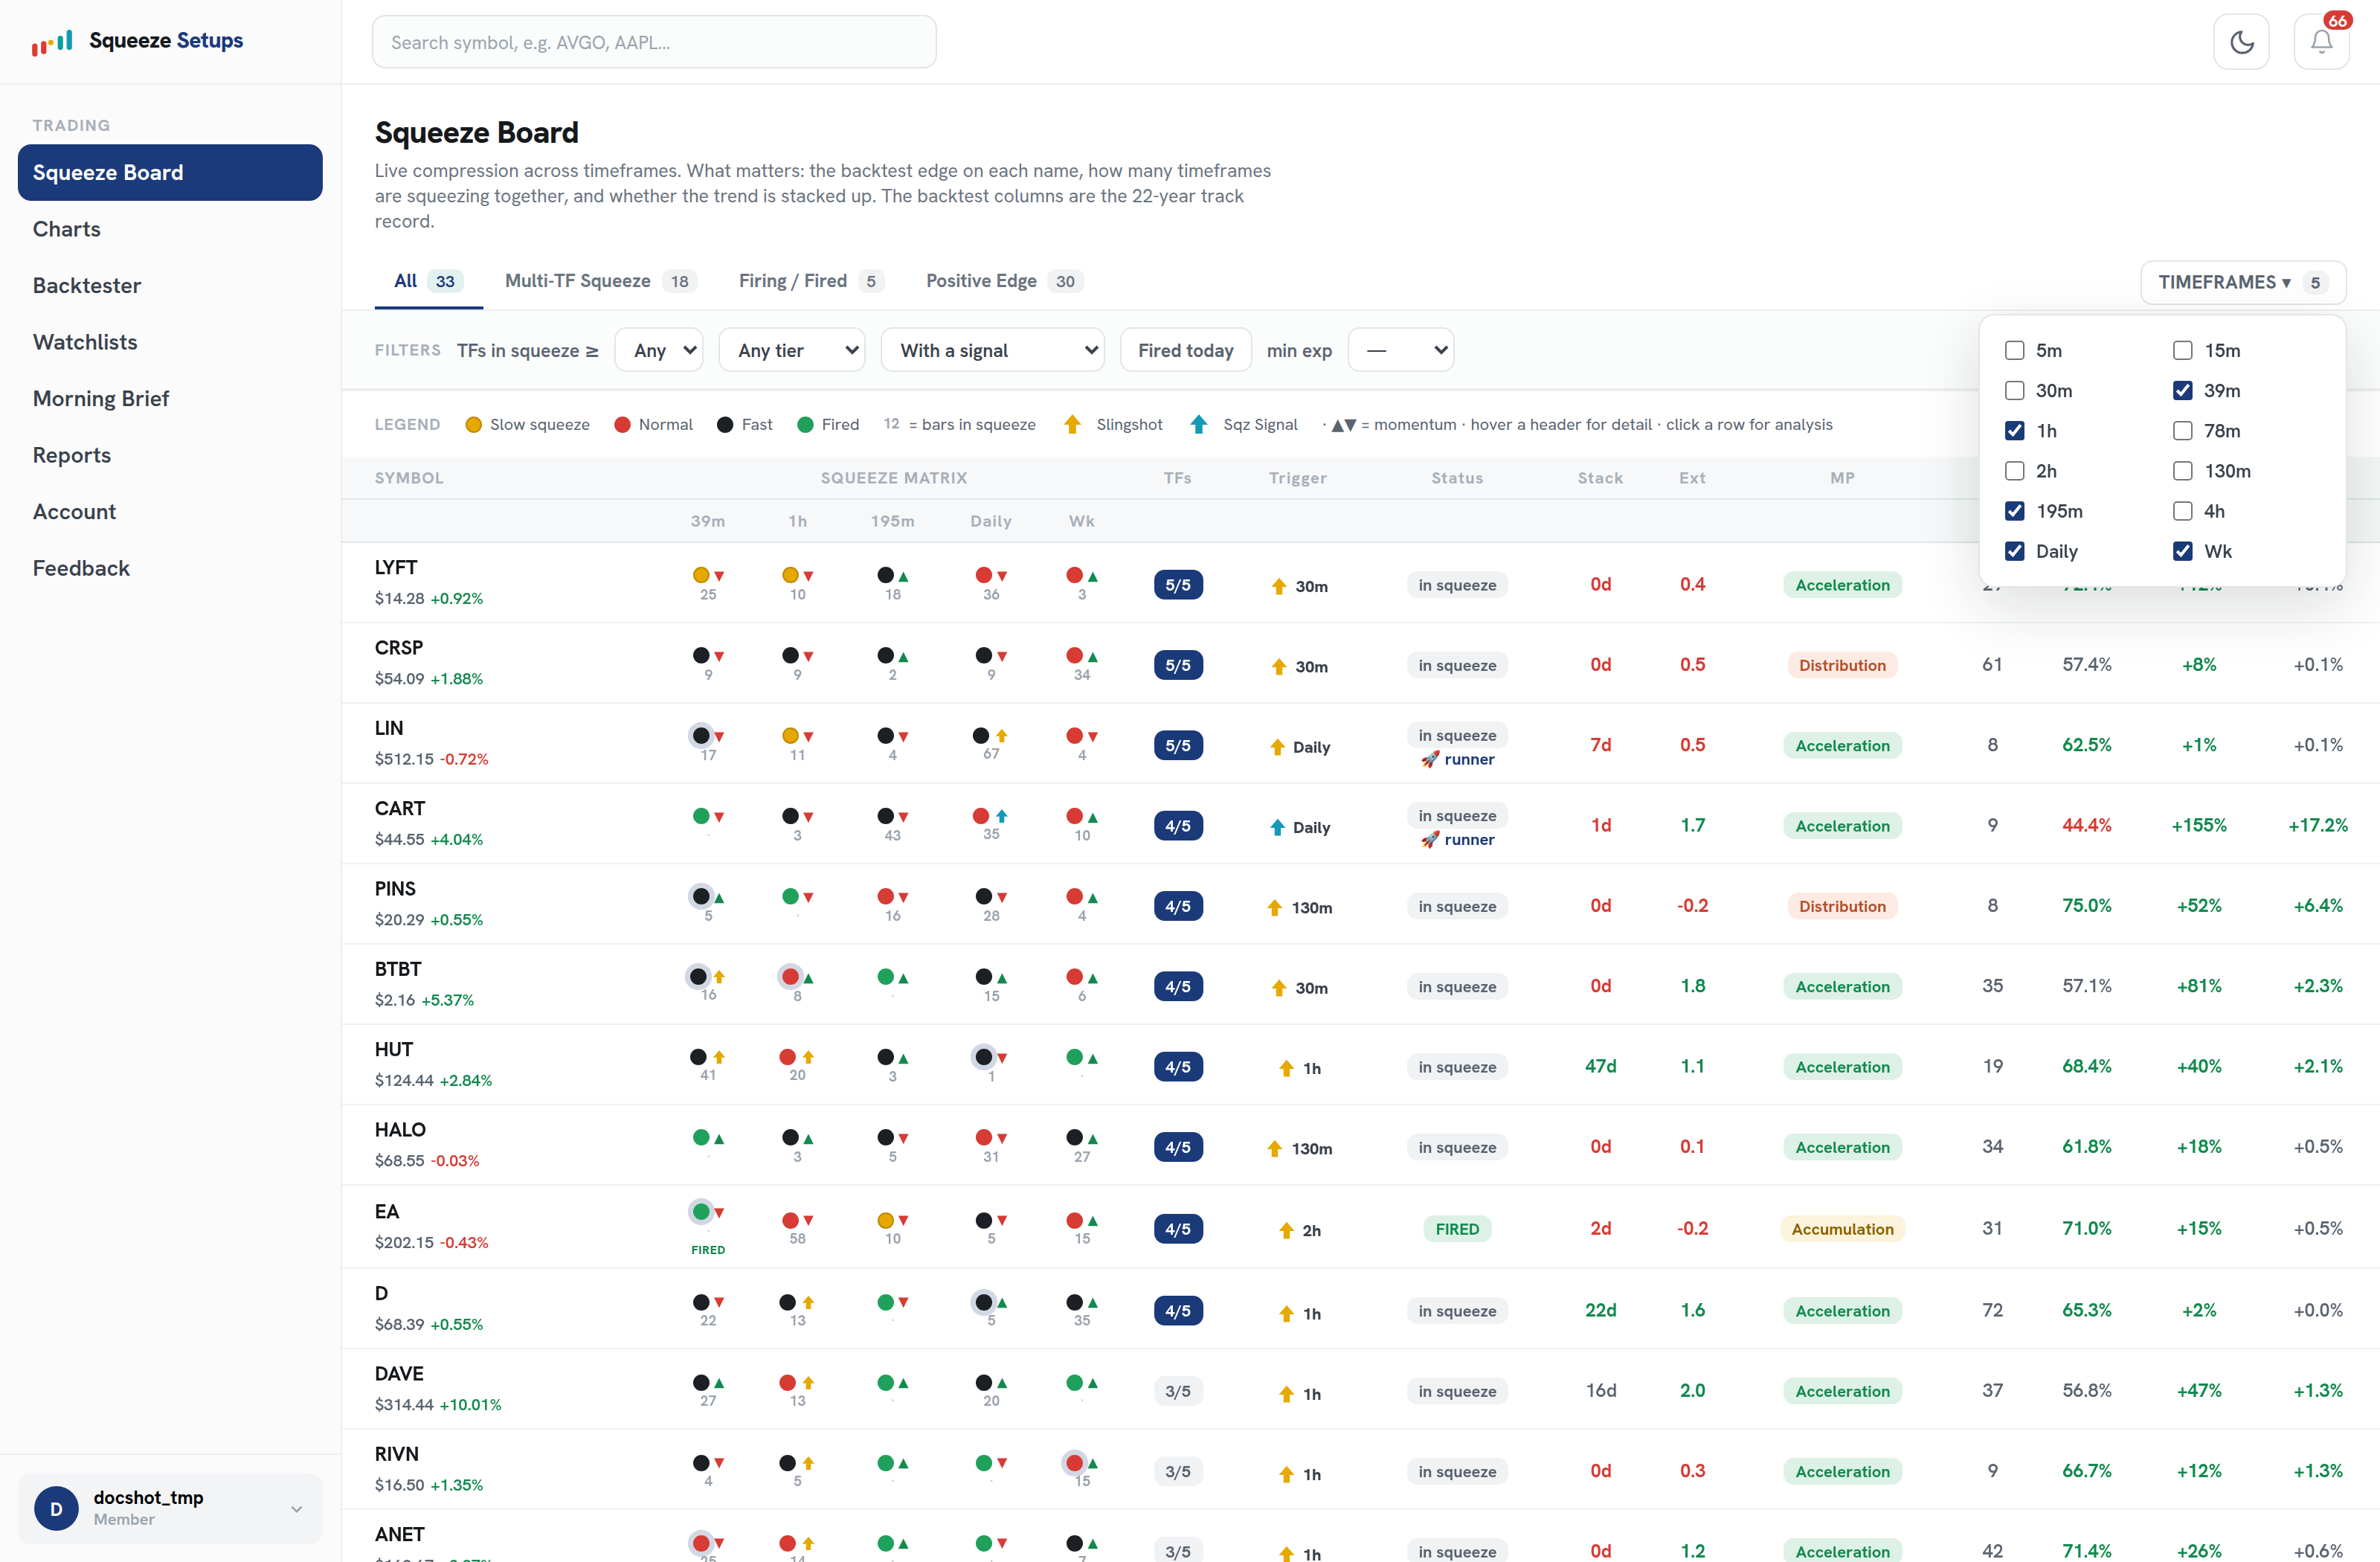
Open the picker, check the timeframes you want, and the matrix redraws immediately. The “TFs” count (for example 5/5) recalculates against the timeframes you have chosen to show, so confluence is measured on your selection, not on every timeframe in the system. The Trigger, Status, Stack, Ext, MP, and 22-Yr Backtest columns are unaffected; you are only narrowing the matrix.
Our per-timeframe results are not equal. On the Slingshot Squeeze, the daily timeframe carries the strongest expectancy at +0.93% per trade, and it falls off as you go faster. If you want the board to reflect where the results are strongest, show the higher-expectancy timeframes.
| Timeframe | Slingshot expectancy / trade |
|---|---|
| Daily | +0.93% |
| 4h / 240m | +0.56% |
| 30m | +0.51% |
| 195m | +0.44% |
| 130m | +0.41% |
| 78m | +0.18% |
| 2h / 120m | +0.15% |
| 1h / 60m | +0.10% |
| 39m | +0.06% |
| 5m | +0.01% |
| 15m | about -0.04% |
Note that the daily Squeeze Signal is also validated, but the intraday Squeeze Signal backtest is still in progress. Showing intraday columns is fine for scanning; just remember the intraday Squeeze Signal numbers are not finalized. To get every column back, use Clear all on the filter row, which resets the picker along with the rest of the filters.
How does the active symbol follow me between views?
When you are working a name, you usually want to see it three ways: its row on the board, its candles in Charts, and its full record in the Backtester. Symbol sync keeps one symbol active across all three so you do not retype it. Click a row’s Charts or Backtester button from the symbol drawer, and that view opens already loaded on the same symbol. The quick-switch chips at the top of Charts and the Backtester let you flip to a recent or pinned symbol without going back to the board, and the active symbol stays linked as you move.
A typical loop looks like this:
- On the board, click a row to open the symbol drawer and read the three-pillar verdict (trend stacked, timeframe confluence, positive backtest).
- Open the symbol in Charts to see the trigger arrow marked under the trigger candle on its timeframe, with the squeeze row below price.
- Open the same symbol in the Backtester to read the full 22-year record: trades, win %, net, expectancy, and the cumulative equity curve.
- Use a quick-switch chip to jump to the next name and repeat, without losing your place.
Symbol sync removes the retyping and the need to re-check which symbol you were on, so the only thing that changes between views is what you are looking at, not which stock.
How do I turn on Dark Mode?
Dark Mode is a theme toggle. It swaps the workspace to a dark background and lightens text, which most people find easier during a long scanning session or in a dim room. Flip the toggle and the board, drawers, Charts, and Backtester all switch together.
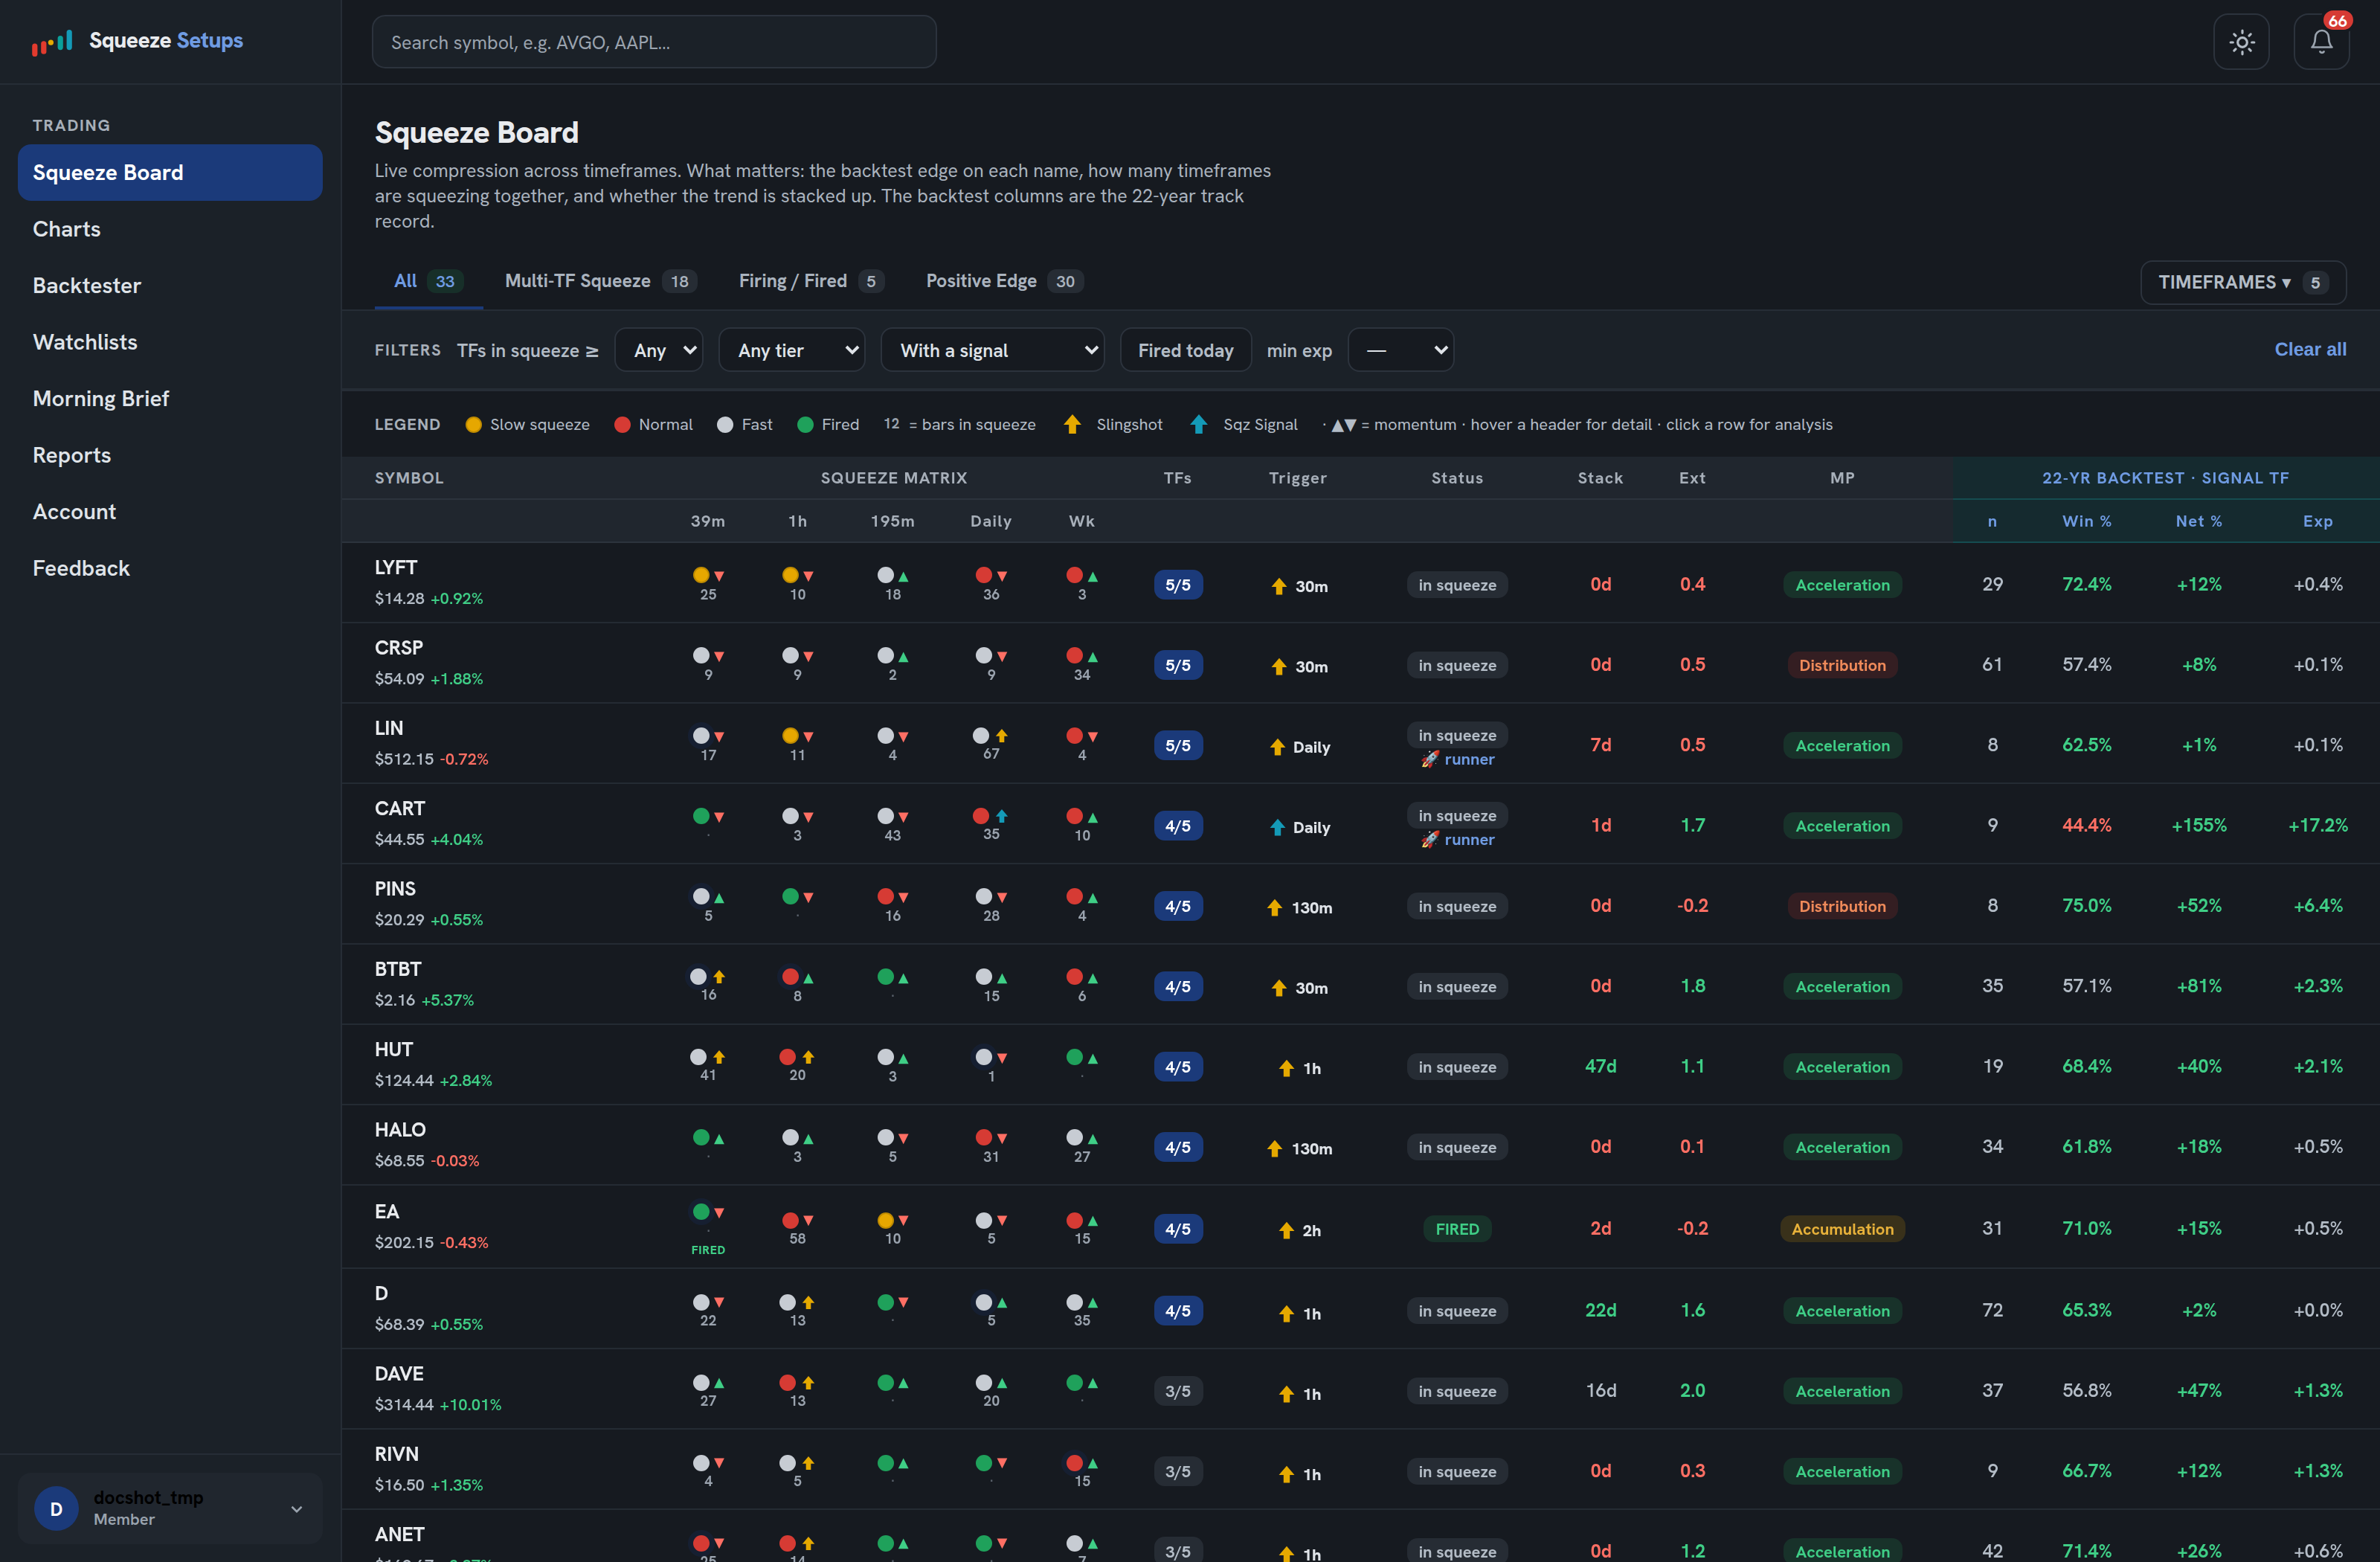
The one thing worth checking is color. The dot tiers and trigger arrows carry meaning:
- Yellow for Tight (the tightest).
- Red for Mid.
- Black for Loose (the loosest).
- Green for Fired.
- Gold arrows for the Slingshot Squeeze.
- Cyan arrows for the Squeeze Signal.
Those colors are tuned to stay legible in both themes, but black dots sit on a dark field, so if you rely heavily on spotting the loose tier at a glance, take a moment to confirm it reads the way you expect before you trade off it. The toggle is purely cosmetic; it does not change any data, ranking, or backtest result.
Squeeze Setups is an educational research tool, not financial advice.
Related: How to read the Squeeze Board, Using Charts, Watchlists