How the Platform Ranks and Qualifies Setups
Goal: Understand why one stock sits above another on the Squeeze Board, and what the platform is actually measuring when it qualifies a setup.
You need: Access to the Squeeze Board and a symbol drawer. No setup required; this is a read-only walkthrough of the ranking logic.
The platform ranks rows by three pillars: backtest edge (the per-symbol 22-year record), timeframe confluence (how many shown timeframes are in a squeeze), and trend (whether the EMA 8>21>34 stack is intact). A row scores well when all three line up. That score is a rank, a way to put the best-looking setups at the top of the list. It is not a promise that the trade works.
What are the three pillars?
Every ranking decision traces back to the same three inputs. We keep them separate on purpose, because each answers a different question.
- Backtest edge. The per-symbol 22-year record. For each of our 614 stocks we ran the setup against daily data from 2004 to 2026 and stored the result: number of trades, win rate, net, and expectancy per trade. A name with a long positive record carries more weight than a name that has never paid for this setup.
- Timeframe confluence. How many of the shown timeframes are in a squeeze at once. This is the TFs column, read as a count like 5/5. More agreement across timeframes means the compression is broad, not a single-chart fluke.
- Trend. The EMA 8>21>34 stack. When the fast average sits above the medium above the slow, price is in a clean uptrend and the setup is firing in the direction the stock is already moving.
Where do the pillars show up on the board?
The board is one ranked row per stock, and each pillar has its own column. You do not have to open anything to see why a row ranks where it does; the evidence is laid out across the row.

Reading left to right, the columns that feed the rank are:
- SQUEEZE MATRIX and TFs. One dot per timeframe (dot color is the tier, the number on the dot is bars in the squeeze, the small triangle is momentum direction). The TFs count, for example 5/5, is the confluence pillar in a single number.
- Stack. The days the bullish EMA stack has held. A longer stack is a stronger, more established trend pillar.
- 22-Yr Backtest. n trades, Win %, Net %, and Exp. This is the edge pillar, and it is the one we trust most because it is the only one built from realized outcomes rather than the current chart.
The Trigger, Status, Ext, and MP columns add context (which setup fired, whether it is in a squeeze or FIRED, how extended price is, and the Market Pulse regime), but the rank itself is driven by the three pillars above.
How the drawer scores the three pillars
Click a row and the symbol drawer opens with a plain-language verdict. The verdict scores the same three pillars explicitly, so you can see which ones are pulling the rank up and which are dragging it down.
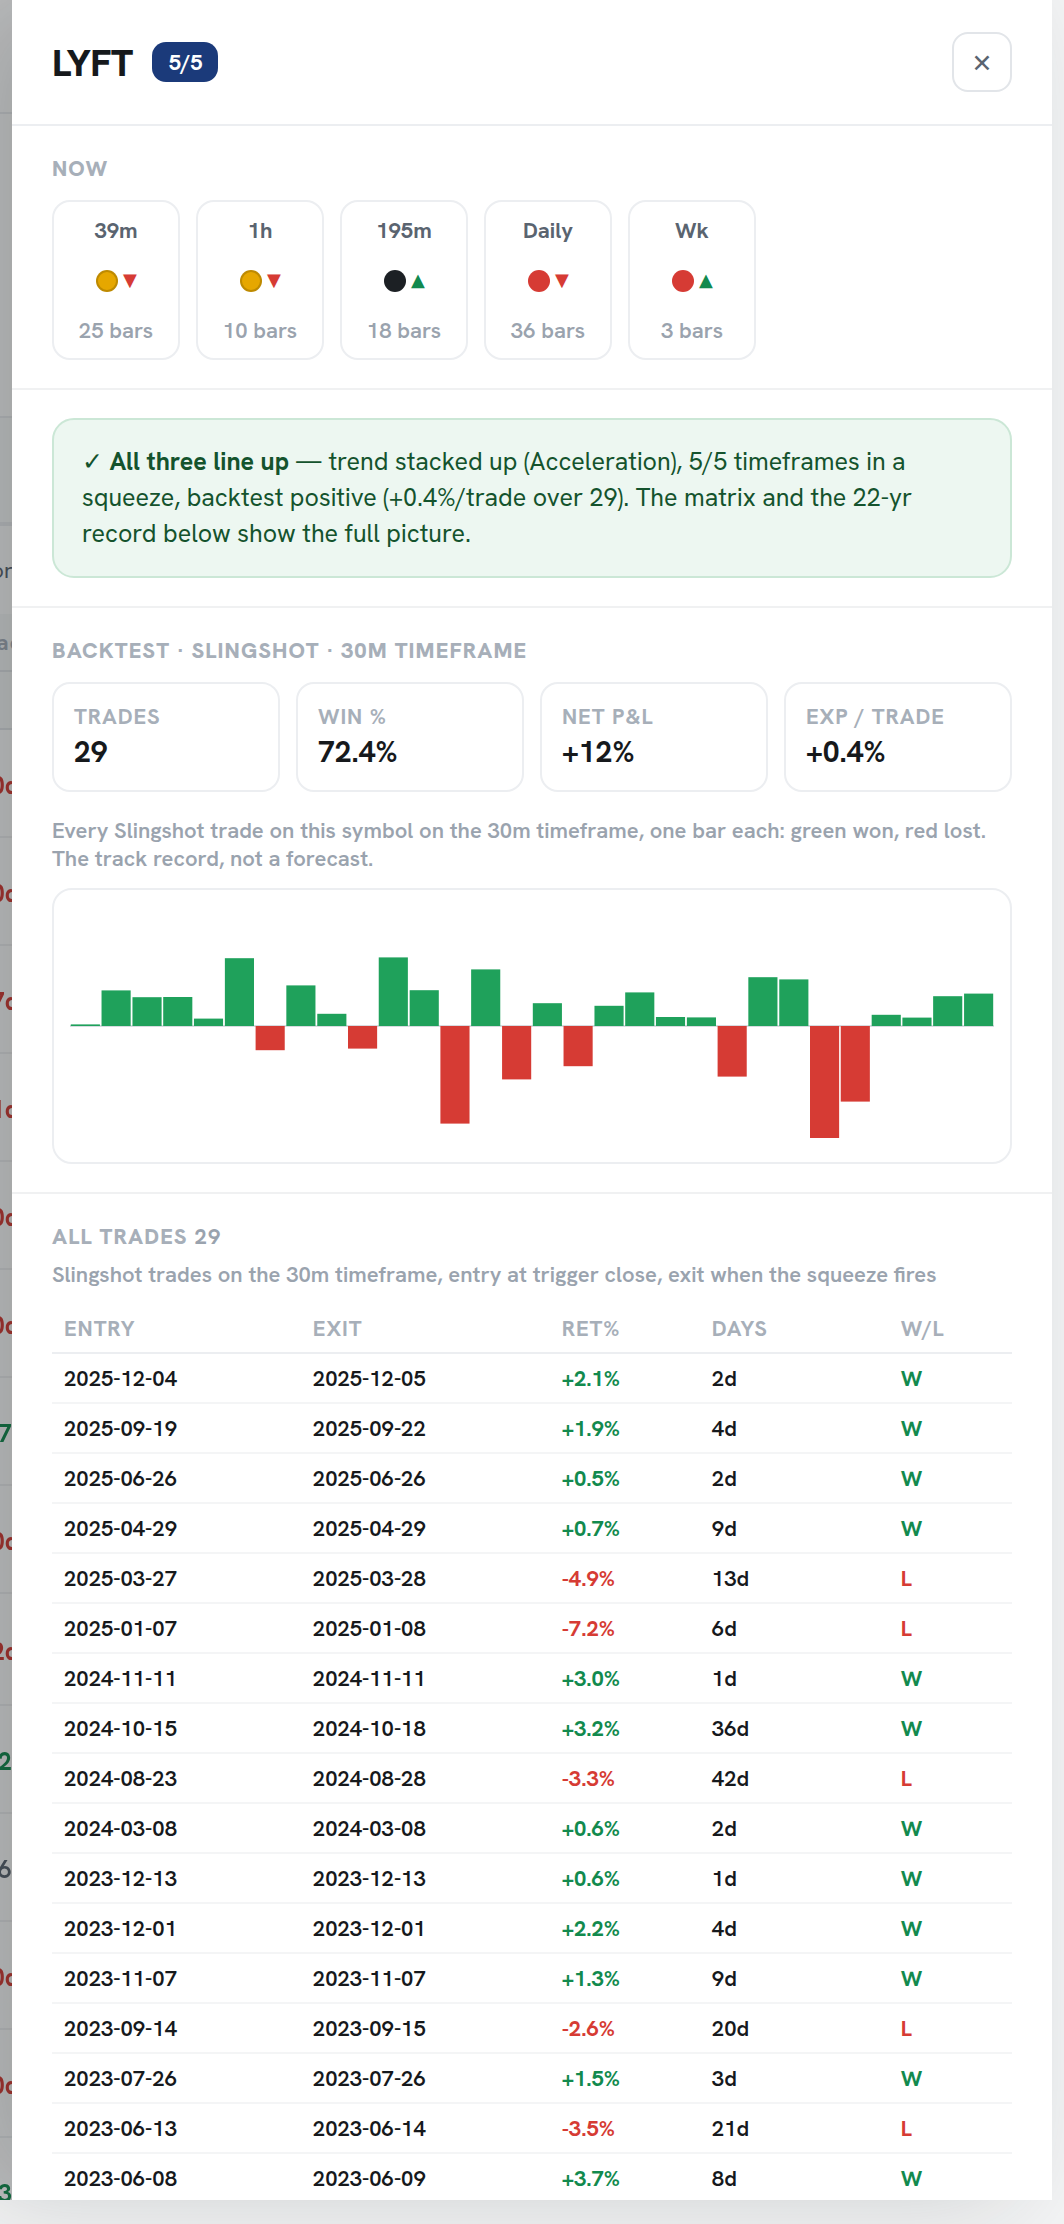
The drawer checks, in order:
- Trend stacked? Is the EMA 8>21>34 stack intact right now.
- Timeframe confluence? Are enough shown timeframes in a squeeze together.
- Positive backtest? Does this exact symbol have a positive per-symbol 22-year record for the setup.
Below the verdict you get the full 22-year record (win rate, an equity strip, and every trade), plus buttons to open the symbol in Charts or the Backtester. The verdict is a summary of the rank; the record underneath it is the evidence. When the three pillars disagree, the drawer shows you the disagreement rather than hiding it behind a single number.
Why a high rank is not a high probability of profit
The rank sorts setups by how closely they match the conditions that paid in the past. It does not raise the odds of any single trade. Take our strongest validated setup, the daily Slingshot Squeeze:
- Won 69.1% of the time across 5,852 trades.
- Era-stable between 66.8% and 70.9% across five separate eras.
- That is a real edge, and it still means one trade in three lost.
A few things the rank deliberately does not do:
- It does not predict the next move. The 22-year figures are historical backtests, before commissions and slippage, never a forecast.
- It does not assume an edge transfers. Edge is stored per symbol because it is per symbol. A great record on one stock says nothing about another.
- It does not flip your direction for you. We are long-biased by default. The short Slingshot won 60.3% of the time but carried negative expectancy of about -2.0% per trade, so a high short win rate is not a green light.
How the pillars combine in practice
The pillars are not equally informative, so it helps to know what each one rewards and how much weight to give it when you read a row.
| Pillar | Board column | What a strong score means |
|---|---|---|
| Backtest edge | 22-Yr Backtest (Win %, Net %, Exp) | This symbol has historically paid for this setup; the only pillar built from realized outcomes |
| Timeframe confluence | TFs (e.g. 5/5) and the squeeze matrix | Compression is broad across timeframes, not a single-chart artifact |
| Trend | Stack (days held) | Price is in an established EMA 8>21>34 uptrend the setup can fire with |
A top-of-board row is one where all three agree: a positive per-symbol record, several timeframes in a squeeze together, and a clean, durable trend stack. When you want to filter to exactly that, use the board’s Positive Edge tab and the min expectancy filter to drop the names whose history does not support the trade. The rank does the sorting; the filters let you set the floor.
Squeeze Setups is an educational research tool, not financial advice.
Related: How to read the Squeeze Board, Multi-timeframe squeeze confluence, Backtesting the squeeze: 22 years per symbol.