Learn / Docs
Squeeze Glossary
Goal: Understand every term you will see on the Squeeze Board, in the symbol drawer, the Backtester, and across our docs.
You need: Nothing but this page. Bookmark it and come back whenever a label is unclear.
This is a reference, not a tutorial. Every entry below is one or two sentences and matches exactly what the platform shows you. If you want the full how-to instead, see how to read the Squeeze Board.
Core concepts
- Squeeze
- A period when a stock’s range tightens to the point that volatility has compressed. On the board, a colored dot means that timeframe is in a squeeze, and the number on the dot is how many bars the squeeze has lasted.
- Fired
- The moment a squeeze releases. The dot turns green and the Status column reads “FIRED.” For our setups the fire is the EXIT, not the entry. You enter on the trigger while the squeeze is still on.
- Runner
- A signal that took off and never pulled back. In our long backtest about 46% of signals never gave back 1 ATR, and those runners won about 92%. The board flags these with a runner chip in the Status column.
- Confluence
- How many of the shown timeframes are in a squeeze at the same time, displayed in the TFs column (for example 5/5). More timeframes lining up is one of the three pillars we rank by.
Dot tiers
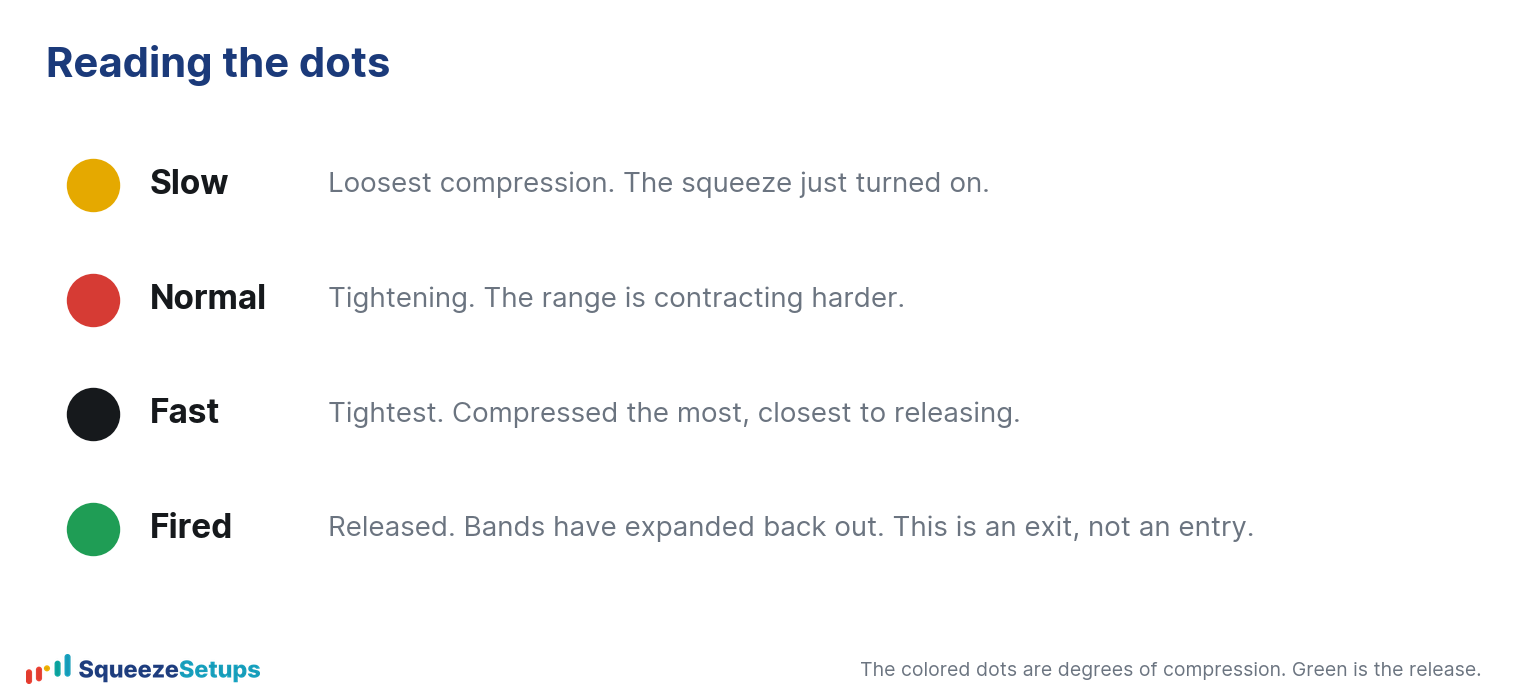
Each dot on the Squeeze Matrix is colored by tier, which tells you how tight the squeeze is on that timeframe.
| Tier (dot color) | Meaning |
|---|---|
| Yellow | Tight. The tightest tier, most compressed. |
| Red | Mid. The middle tier. |
| Black | Loose. The loosest squeeze still on. |
| Green | Fired. The squeeze has released; this is the exit cue, not an entry. |
Board columns and chips
- Stack
- The number of days the bullish EMA stack (8 above 21 above 34) has held. Trend is one of our three pillars, and a longer stack means the uptrend has stayed intact.
- Extension (Ext)
- How far price sits above its mean, measured in ATRs. It is a stretch gauge: a high Ext means price has run far from where it usually trades.
- Market Pulse (MP)
- A read on the broader tape, shown as one of four states: Acceleration, Accumulation, Distribution, or Deceleration.
- Trigger
- The arrow that names which setup just signaled and on what timeframe. A gold arrow is a Slingshot Squeeze; a cyan arrow is a Squeeze Signal.
The setups
- Slingshot Squeeze
- Enter when momentum turns up from below zero while the squeeze is still on, in a stacked uptrend, with Edge Signal confirmation. On daily data it won 69.1% across 5,852 trades at +0.93% average per trade, era-stable from 66.8% to 70.9%.
- Squeeze Signal
- A continuation entry: momentum is already above zero and the compression tightens a tier. On daily data it won 67.4% across 4,496 trades at +0.71% average per trade. Daily is validated; the intraday backtest is still in progress.
- Edge Signal
- The named confirmation layer that both setups require before a trigger counts. We name it but do not publish how it is computed.
Backtest terms
- Expectancy (Exp)
- The average profit or loss per trade over the full record. Daily Slingshot expectancy is +0.93%; lower timeframes are smaller (for example 4h +0.56%, 30m +0.51%, 1h +0.10%), and 15m is roughly -0.04%.
- 22-Yr Backtest
- The per-symbol record over our full universe of 614 stocks on daily data from 2004 to 2026. The board shows n trades, Win %, Net %, and Exp; backtest edge is the first of our three pillars.
- Win rate
- The share of trades that closed green. It does not tell the whole story: short Slingshot won 60.3% yet carried negative expectancy, which is why we are long-biased by default. One trade in three still lost.
Squeeze Setups is an educational research tool, not financial advice.
Related: What is the squeeze?, Squeeze dot colors explained, How to read the Squeeze Board