Not Every Stock Squeezes Well
Key takeaways
- The squeeze setup does not behave the same on every stock. Some names carry a strong multi-year record, others have no edge at all.
- Across our 614-stock universe, the daily Slingshot Squeeze won 69.1% of the time and the Squeeze Signal 67.4%, but those are averages: individual symbols sit well above and well below them.
- The check is simple: read the symbol’s 22-year per-symbol backtest before you act, and skip names that show no edge.
- The short setups show this clearly. Short Slingshot won 60.3% of trades yet lost money on average, so a high win rate alone is not an edge.
A squeeze tells you a stock is compressed and likely to expand. It does not tell you whether this stock has historically paid you for trading that expansion. That second question is what separates a setup worth taking from one worth skipping, and the answer is different for almost every symbol. Our backtest runs each name on its own daily data from 2004 to 2026, and the spread between the best and worst responders is large. The practical rule is simple: check the per-symbol record first, act second.
Why does the same setup work on one stock and not another?
A squeeze is a measurement of volatility compression. It fires the same way on a steady trender and on a choppy, mean-reverting name. But the trade that follows depends on how the stock behaves once volatility returns, and that behavior is a property of the stock, not of the indicator. Some names expand cleanly in the direction of trend; others fake out, gap against you, or chop sideways until the squeeze resets. The indicator is identical in both cases. The outcome is not.
This is why a single headline win rate can mislead. The daily Slingshot Squeeze averaged 69.1% across the universe (5,852 trades, +0.93% average per trade), and the win rate held between 66.8% and 70.9% across five separate eras, so the average is stable over time. But an average is built from symbols that did much better and symbols that did much worse. Trading the average instead of the symbol means accepting the weak names along with the strong ones.
A high win rate is not the same as an edge
The cleanest proof that win rate alone can fool you is the short side. The short Slingshot Squeeze won 60.3% of its trades, which sounds tradeable. It was not. Average expectancy was roughly -2.0% per trade: the losses were large enough that winning three out of five still lost money. A setup can win more often than it loses and still lose money overall.
That is why we are long-biased by default and why short setups only earn a place on names that show a positive per-symbol short record. Expectancy, not win rate, is the number that decides whether a setup is worth taking. The board surfaces both so you are never reading one without the other.
Bare squeezes do not carry an edge on their own
Before assuming any squeeze is worth trading, it helps to know what the bare signal is actually worth. Entering simply because a stock is in a squeeze won about 53.9% of the time, which is no better than buying a random day in our universe (53.7%). Common tweaks barely moved it:
- Waiting for five dots reached ~54.1%.
- Buying the first green dot ~54.8%.
- Pullback entries were worse than random (~45.5% to a 34 EMA, ~44.4% to a 50 SMA).
So the squeeze by itself is a starting condition, not a trade. The edge comes from the full setup, the Slingshot Squeeze or Squeeze Signal, applied to a name whose own history supports it. That last clause is the one traders skip.
How do I check whether a stock squeezes well?
The platform answers this directly. Every row on the Squeeze Board ends with a 22-Yr Backtest block showing n trades, Win %, Net %, and Exp (expectancy per trade) for that specific symbol. The Positive Edge board tab and the min expectancy filter let you hide names that do not clear a bar you set, so weak responders never reach your screen in the first place.
When you want the full picture for one name, open the Backtester. Type the symbol, pick Slingshot or Squeeze Signal on the daily timeframe, and read the complete record.
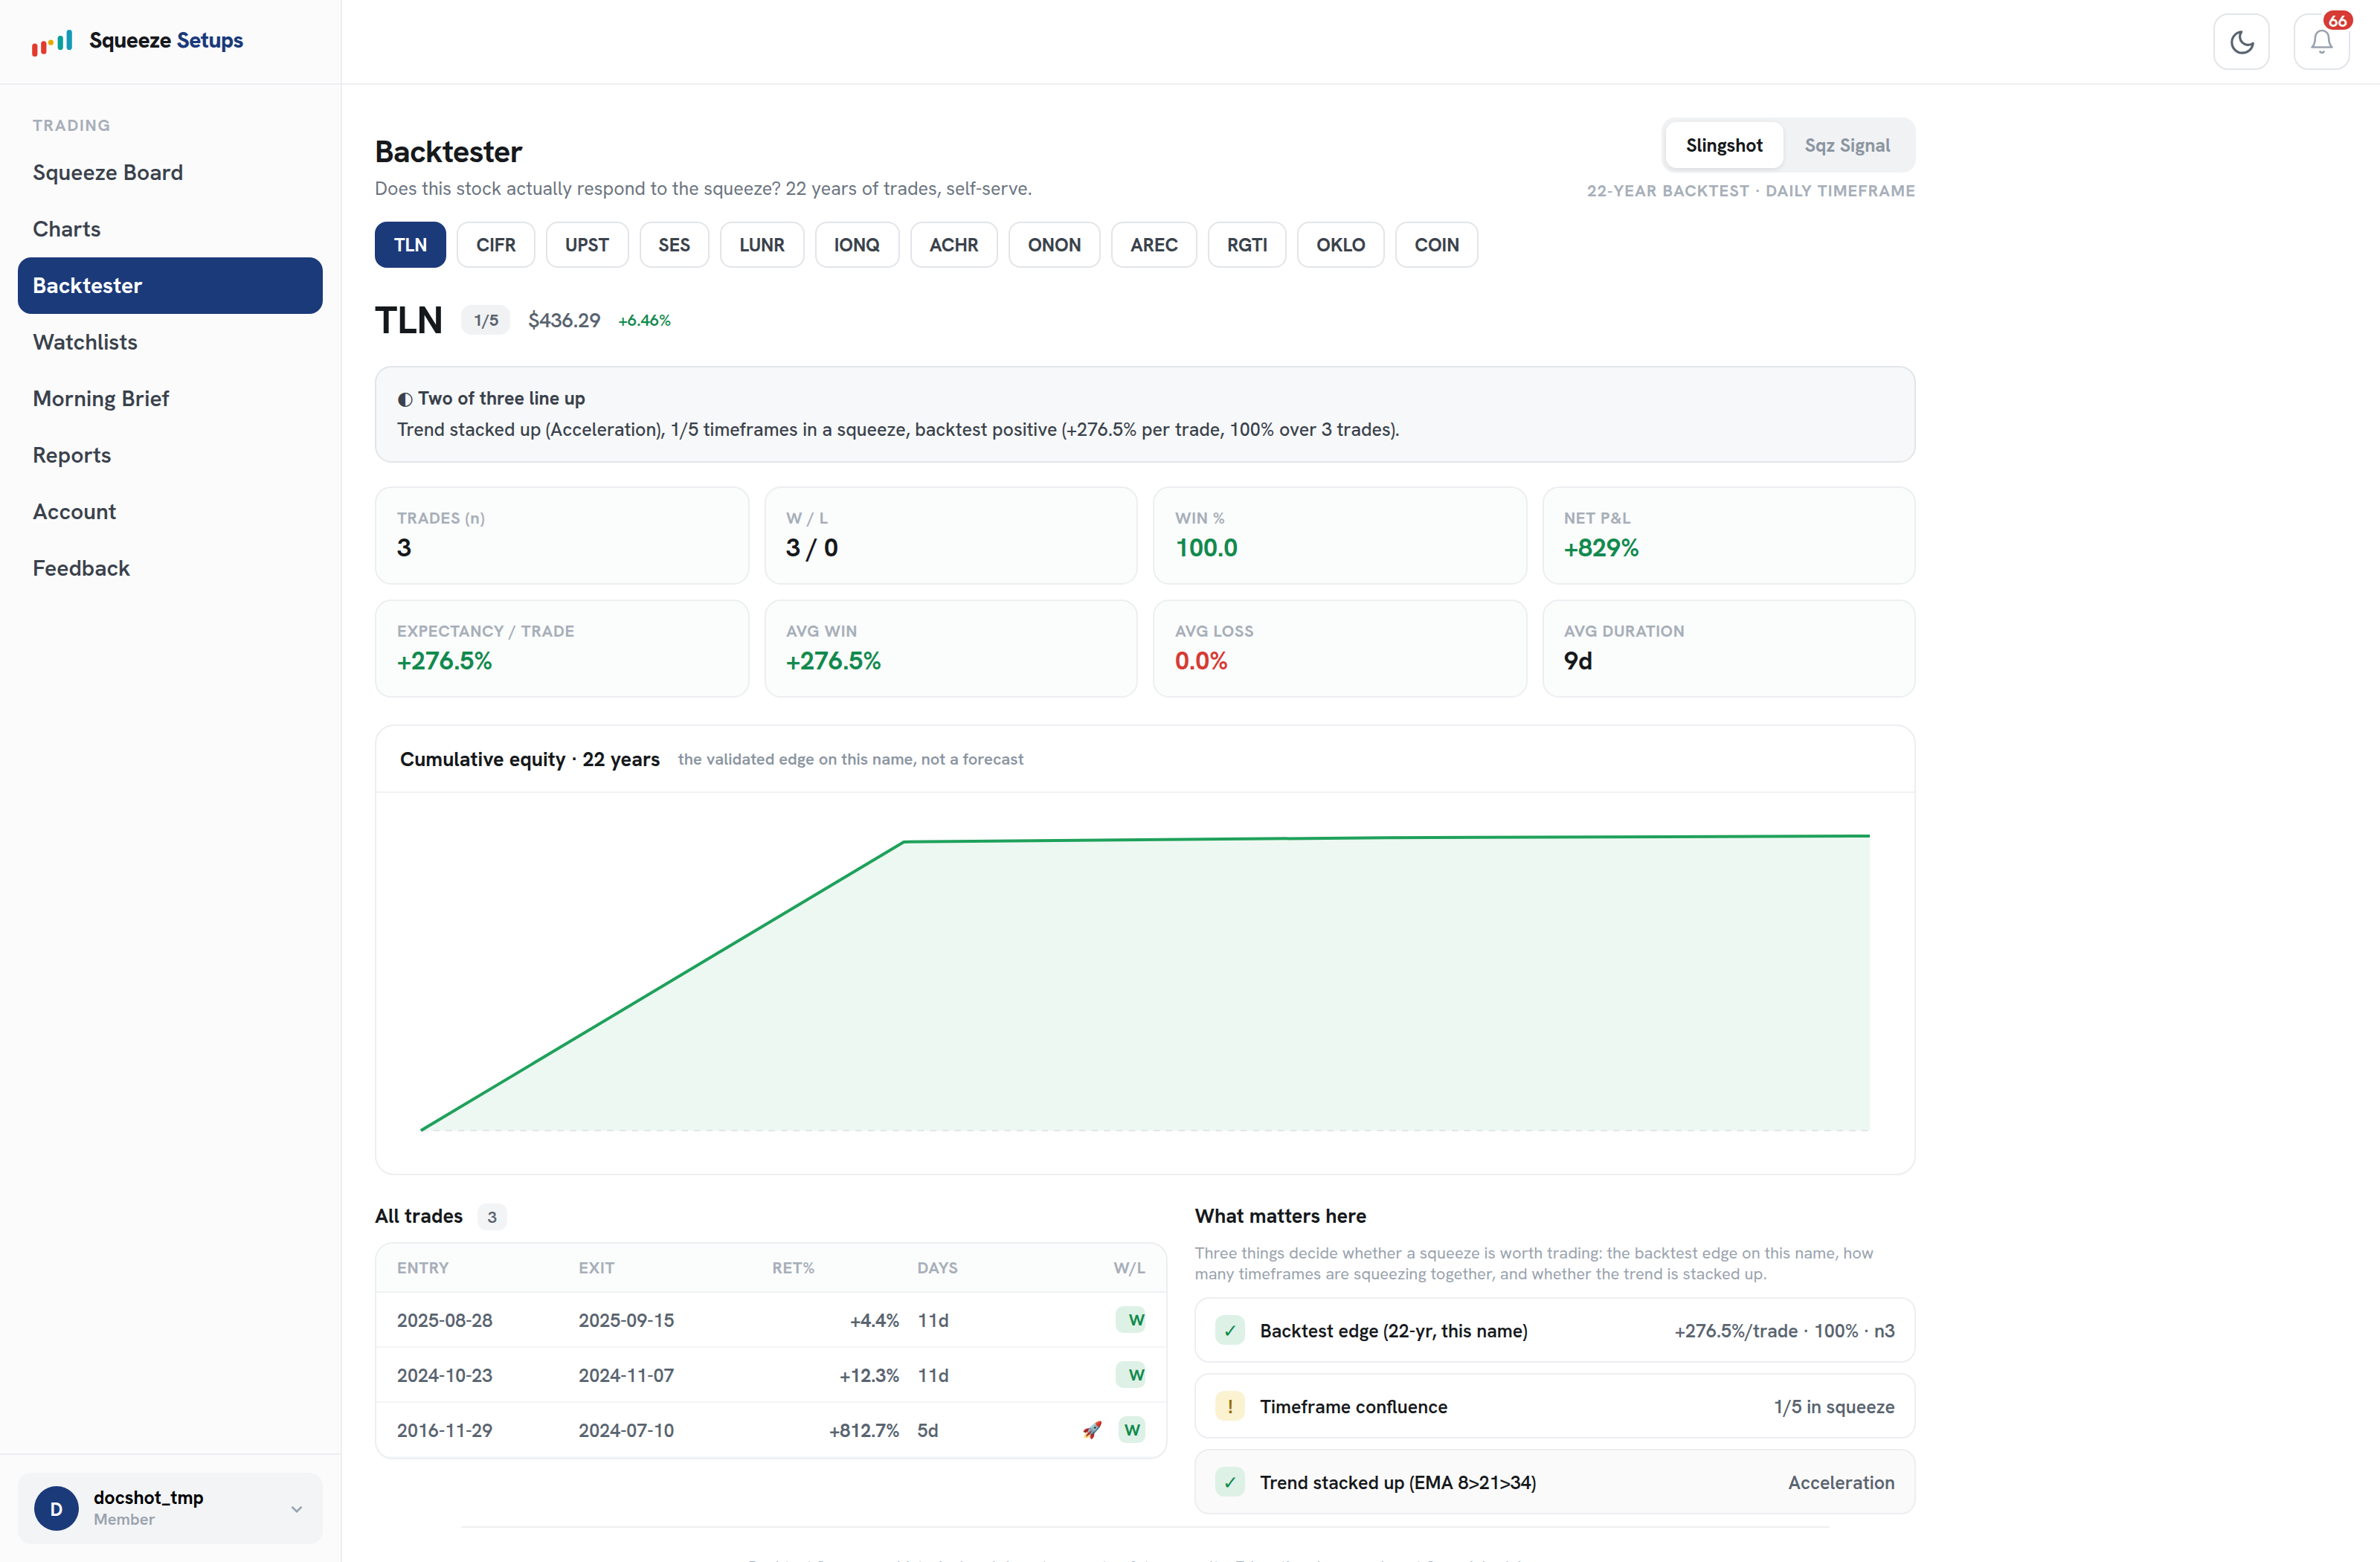
The Backtester also shows average win, average loss, average duration, the full trade list, and a “What matters here” panel scoring the three pillars we rank by: the per-symbol backtest edge, timeframe confluence, and the EMA 8>21>34 trend stack. If the equity curve is flat or the expectancy is near zero, that is your answer: this name does not squeeze well, regardless of how tight the dots look today.
Timeframe is part of “squeezes well” too
The same logic applies across timeframes, not just across symbols. A name can have a real edge on the daily and almost none on a fast intraday chart. Our per-timeframe Slingshot expectancy makes the pattern clear: the daily is the strongest, and edge generally thins as the timeframe shrinks.
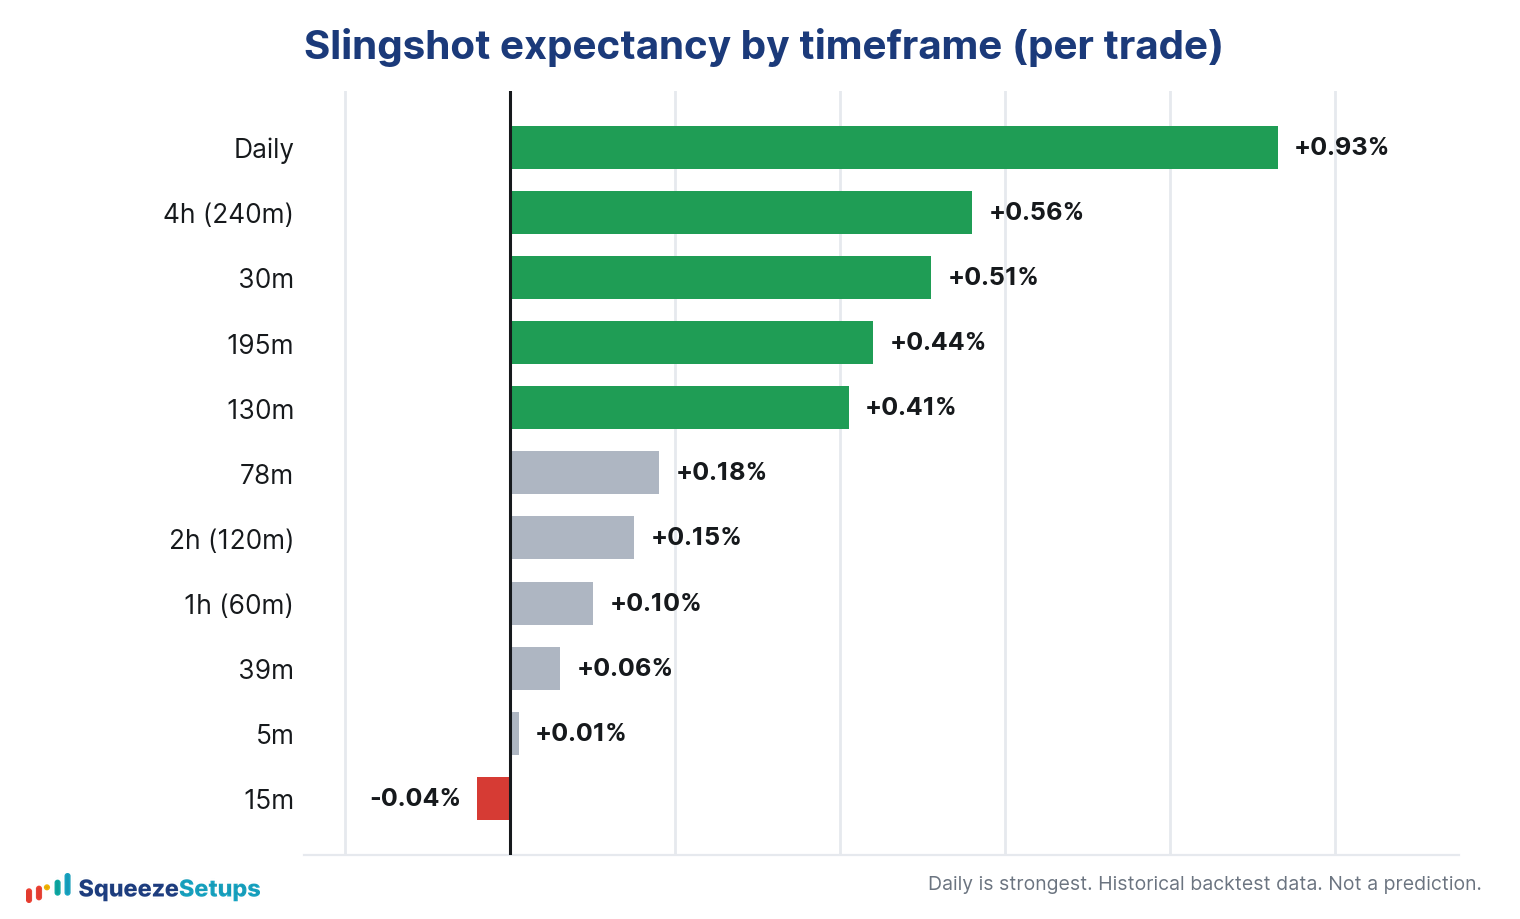
| Timeframe | Expectancy per trade |
|---|---|
| Daily | +0.93% |
| 4h / 240m | +0.56% |
| 30m | +0.51% |
| 195m | +0.44% |
| 130m | +0.41% |
| 78m | +0.18% |
| 2h / 120m | +0.15% |
| 1h / 60m | +0.10% |
| 39m | +0.06% |
| 5m | +0.01% |
| 15m | about -0.04% |
The Squeeze Signal is validated on the daily timeframe only; its intraday backtest is still in progress. So “does this stock squeeze well” really means “does this stock squeeze well, on this setup, on this timeframe.” All three have to line up.
Putting it together
The workflow is short:
- Find a squeeze you like on the board.
- Read its 22-Yr Backtest column or open the Backtester before committing.
- Favor names with positive expectancy and a stable, rising equity curve.
- Skip flat records and skip high-win-rate setups that lose money on average.
Even on the strong names, one trade in three still lost, so position accordingly. These figures are historical backtests, measured before commissions and slippage, and they are never a forecast of the next trade.
Please note: This research is based on historical backtest data. It is NOT a prediction, and it is NOT financial advice.
Related: Backtesting the squeeze: 22 years, per symbol, The Backtester, What is the squeeze?, Build a squeeze watchlist that updates itself