Momentum Colors and the Turn
Key takeaways
- Momentum has two axes that matter: which side of zero it sits on, and whether it is rising or falling.
- “The turn” is momentum curling up from below zero. That is the exact moment the Slingshot Squeeze tries to catch.
- The Squeeze Signal is the other case: momentum is already above zero and the squeeze tightens a tier, a continuation rather than a reversal.
- For both setups you enter while the squeeze is still on. The green fire is the exit, not the entry.
Momentum, drawn as a histogram of bars above and below a zero line, tells you one thing the squeeze dots cannot: direction. The dots tell you a stock is compressed and how tight it is. They say nothing about which way it wants to go. Momentum fills that gap. Read together, “compressed and tightening” plus “momentum turning up” is the difference between a setup with a measured edge and a coin flip. In our 22-year backtest across 614 stocks, a bare squeeze entry won about 53.9%, no better than a random day at 53.7%. The momentum read is a large part of what separates the validated setups from that baseline.
What do the two axes of momentum mean?
The histogram answers two separate questions at once.
The first is position: is the bar above or below zero? Above zero means buyers are, on balance, in control of the recent range. Below zero means sellers are. The second is slope: is each new bar taller or shorter than the one before it? Rising bars mean the current side is gaining force. Falling bars mean it is fading, even if it has not crossed zero yet.
Those two axes give four states:
- Below zero and falling: the deepest selling.
- Below zero and rising: selling that is running out of steam, the early part of a possible bottom.
- Above zero and rising: the cleanest buying.
- Above zero and falling: buying that is tiring.
Color simply encodes the slope so you can see it at a glance: a bar that is taller than the last reads as strengthening, a bar that is shorter reads as weakening. The number on a squeeze dot is bars-in-squeeze and the small triangle is momentum direction, so the board already carries a compact version of this same read in the Squeeze Matrix.
What is “the turn”?
The turn is the moment momentum stops falling and starts rising while it is still below zero. The histogram has been printing shorter and shorter negative bars, and then one bar ticks back up toward zero. Selling pressure has not yet flipped to buying, but it has stopped getting worse, and that is the earliest honest sign that control may be changing hands.
Timing the turn is the entire idea behind the Slingshot Squeeze. We enter when momentum curls up from below zero while the squeeze is still on, in a stacked uptrend (EMA 8 above 21 above 34), with Edge Signal confirmation as a named layer on top. We do not wait for momentum to cross zero, because by then the easy part of the move is often gone. The point is to be early but confirmed, not late.
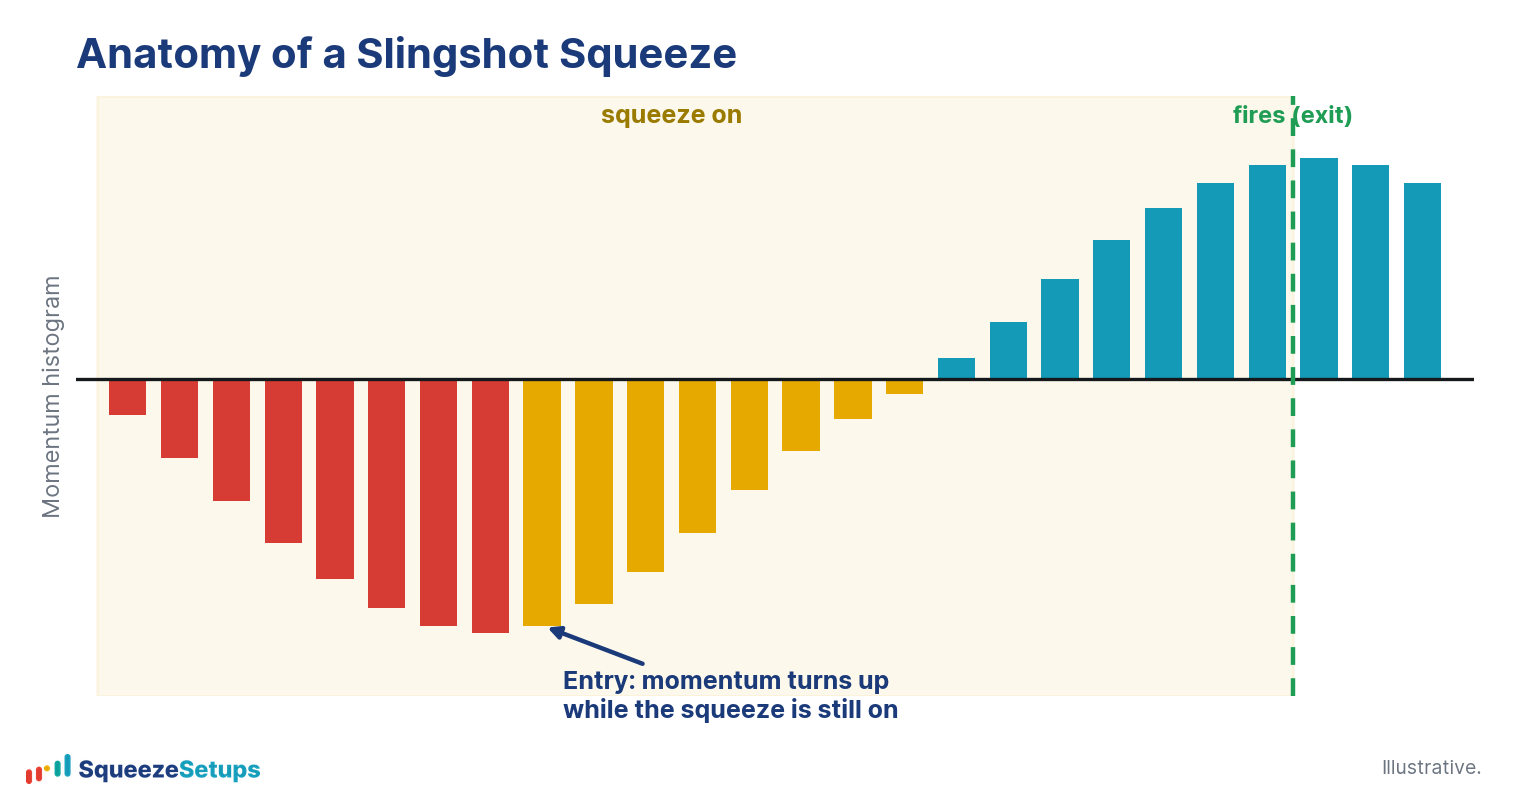
That timing is not free. In the daily backtest the Slingshot won 69.1% of 5,852 trades at +0.93% average per trade, with a roughly 13 day hold and win rate holding between 66.8% and 70.9% across five separate eras. The edge is real and stable, but one trade in three still lost. Catching the turn early means you are sometimes early on a move that does not follow through.
How is the Squeeze Signal different?
The Squeeze Signal is the other side of the momentum picture. Here momentum is already above zero. Buyers are in control, the move is underway, and then the compression tightens a tier (a slower dot stepping to a faster one) while price holds its stacked trend. Rather than calling a reversal from below zero, the Squeeze Signal is a continuation entry: it joins a move that is already working when it pauses and re-compresses, again with Edge Signal confirmation.
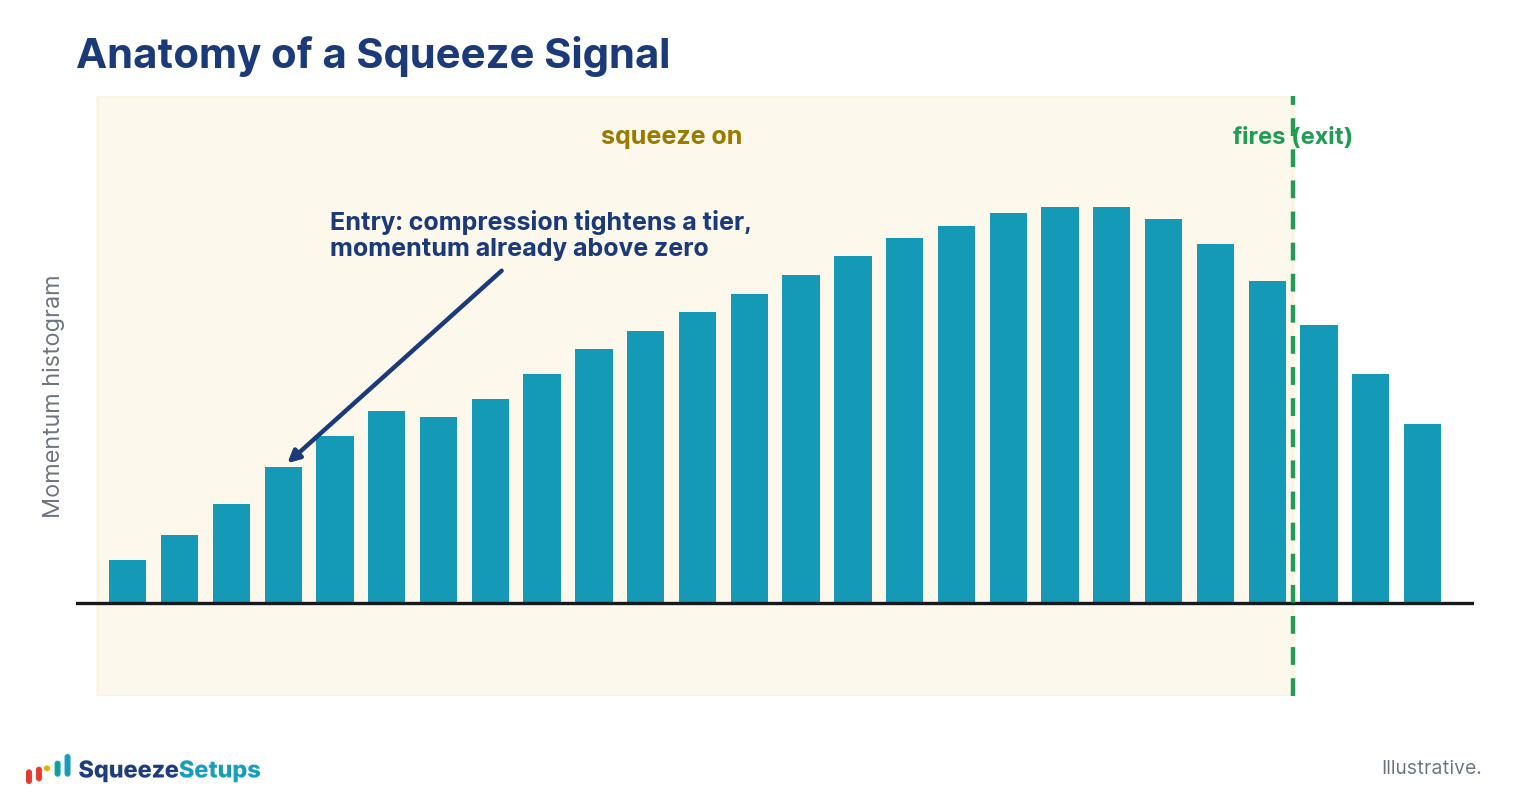
On the daily timeframe the Squeeze Signal won 67.4% of 4,496 trades at +0.71% average per trade, with a roughly 15 day hold and era win rates from 64.9% to 71.3%. Only the daily Squeeze Signal is validated so far; the intraday version is still in progress. The two setups answer different questions about the same histogram, which is why the board labels them with different arrows.
Two entries, one histogram
The cleanest way to hold both setups in your head is by where momentum sits at the moment of entry.
| Setup | Momentum at entry | Read | Trigger arrow |
|---|---|---|---|
| Slingshot Squeeze | Below zero, curling up | Reversal: control may be changing hands | Gold |
| Squeeze Signal | Above zero, tightening a tier | Continuation: an existing move re-compresses | Cyan |
In both cases the rule is the same: you enter on the trigger while the squeeze is still on. The green dot, the “Fired” status, is the release of the compression. That is the exit you are working toward, not the entry. A common mistake is to wait for the fire and buy the green, which means buying after the move the setup was built to catch has already started.
Why direction matters more on some timeframes
The momentum read is the same math on every timeframe, but the payoff is not. Slingshot expectancy per trade is strongest on the daily, then steps down:
- Daily: +0.93%
- 4h: +0.56%
- 30m: +0.51%
- 195m: +0.44%
- 130m: +0.41%
- 5m: +0.01%, with 15m even slightly negative at about -0.04%
The lower timeframes carry more noise, so a turn there is more often a head-fake. This is why we treat the daily chart as the home base for both setups and read shorter timeframes as confluence, not as standalone signals.
One more direction note: momentum that turns up does not mean you must hold for a pullback. In the long backtest about 46% of signals never pulled back a full ATR, and those runners won about 92%, era-stable, while the average adverse excursion was about 1.6 ATR. Reading momentum well is partly about knowing when a move is simply going to run.
Please note: This research is based on historical backtest data. It is NOT a prediction, and it is NOT financial advice.
Related: The Slingshot Squeeze Explained, The Squeeze Signal Explained, The Dots Have No Direction