Trade-Along: One Setup, Start to Finish
Goal: See how one setup moves through Squeeze Setups end to end: spot it on the board, confirm it in the drawer, check the chart, enter on the trigger while the squeeze is on, manage it, and exit on the fire.
You need: a Squeeze Setups account, the Squeeze Board open, and a few minutes to read a single row carefully.
This walkthrough uses a hypothetical symbol, “EXMPL,” to keep the steps clear. The numbers below are illustrative but consistent with our backtests. Nothing here is a real signal or a recommendation. The point is the sequence: every step is something the live UI actually shows you.
Step 1: Spot it on the board
Start on the Squeeze Board. Each stock is one ranked row. We scan three things first: the SQUEEZE MATRIX (one dot per timeframe), the Trigger column, and the 22-Yr Backtest column on the right.

For EXMPL, the row reads like this:
- Matrix: mostly yellow and red dots, so several timeframes are tightly compressed (yellow = Tight, the tightest tier; red = Mid).
- TFs: 5/5, so every shown timeframe is in a squeeze.
- Trigger: a gold arrow tagged “daily,” which is a Slingshot Squeeze on the daily timeframe.
- Status: “in squeeze,” not “FIRED,” so it is still live.
- Stack: the bullish EMA stack has held for several days.
- Ext: low, meaning price is not stretched far above its mean.
Now check the right side. The 22-Yr Backtest column shows n trades, Win %, Net %, and Exp. EXMPL reads 5,852 trades, 69.1% win, and +0.93% expectancy per trade on its Slingshot record. That is a positive per-symbol edge, which is the first of our three pillars. A bare squeeze with no edge is no better than a coin flip (about 53.9% win versus 53.7% for a random day), so this column is what separates a setup worth watching from one that is not.
Step 2: Confirm in the drawer
Click the row to open the Symbol Drawer. The drawer gives a plain-language verdict that scores the same three pillars we rank by: trend stacked, timeframe confluence, and a positive backtest.
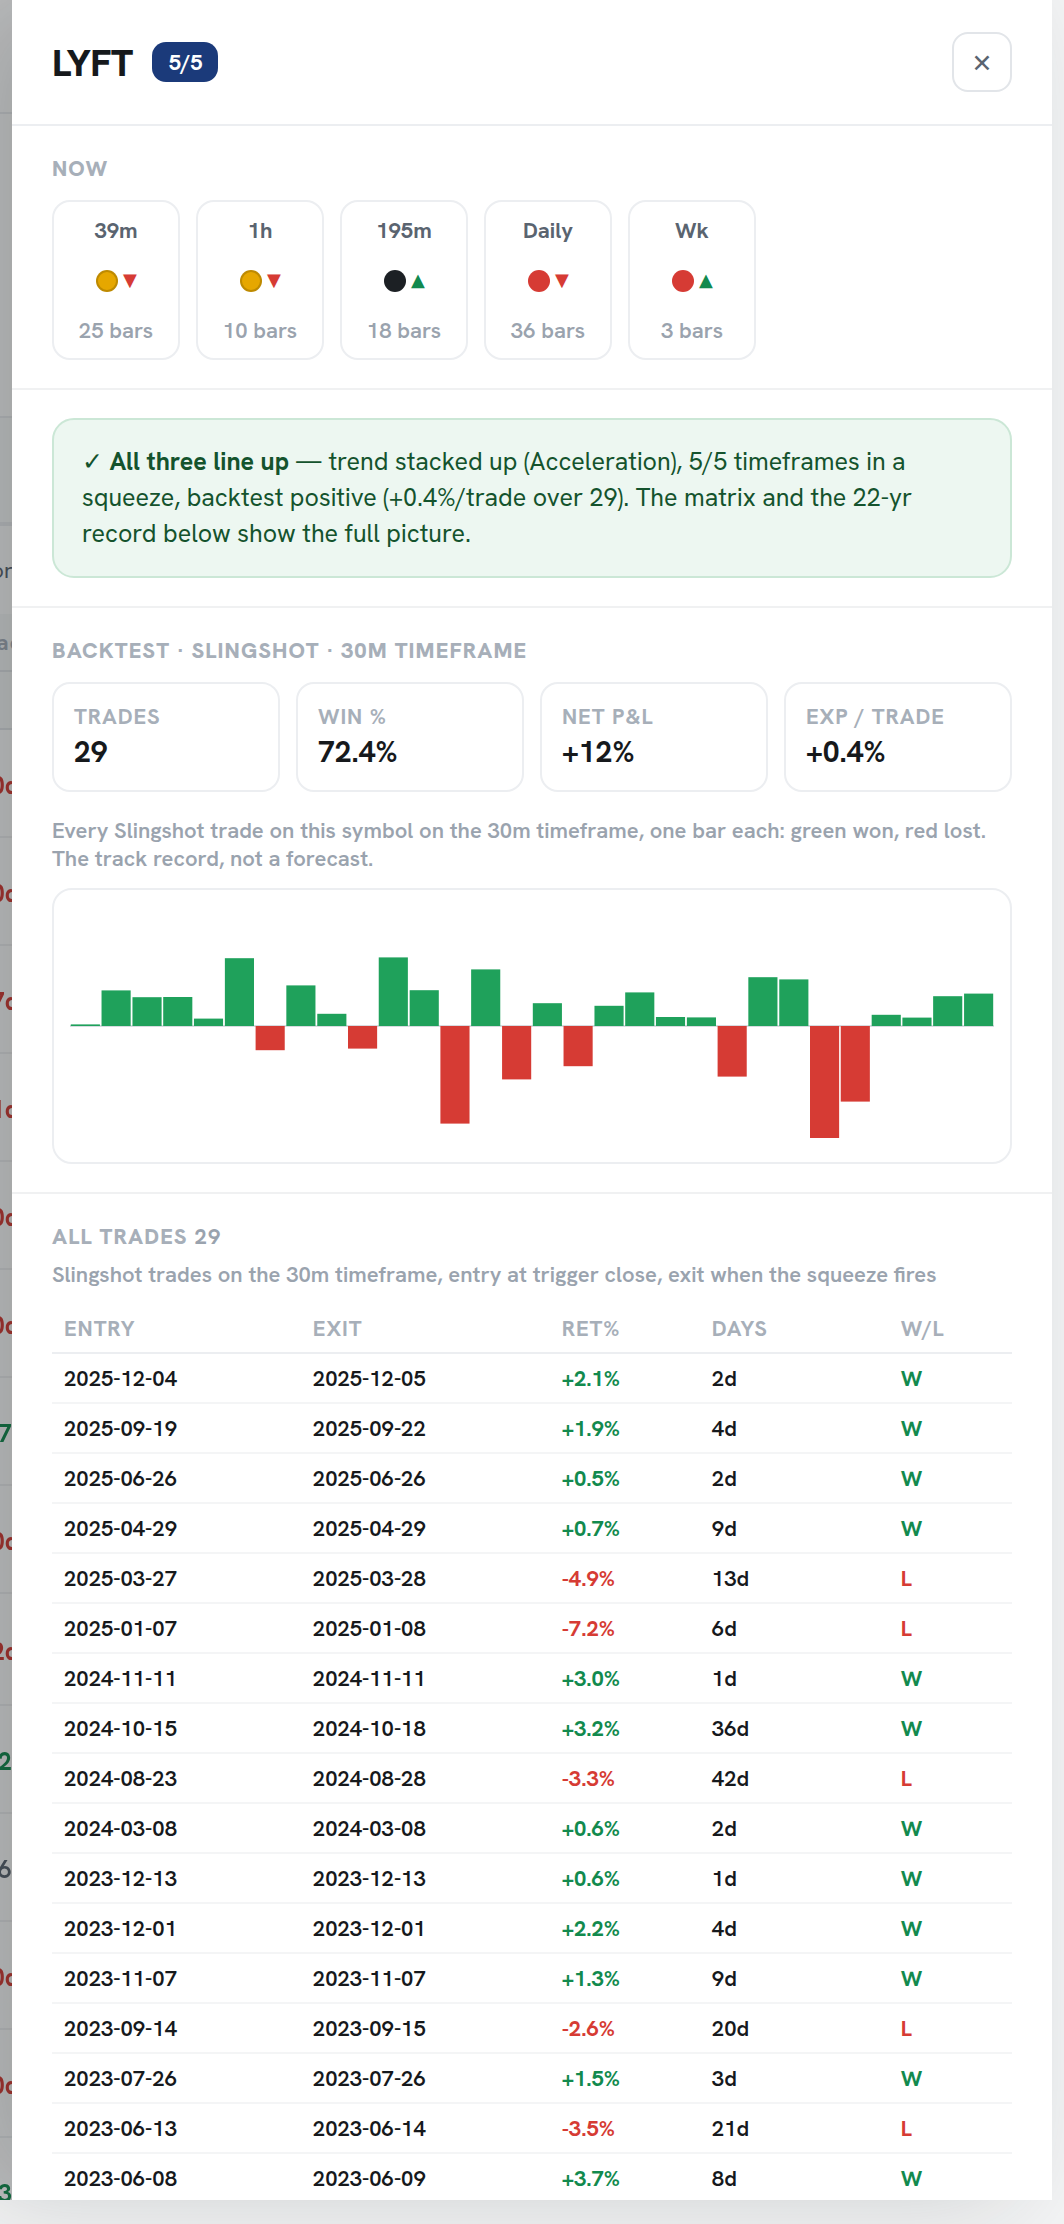
For EXMPL all three pillars are green: the EMA 8>21>34 stack is intact, 5 of 5 timeframes are compressed, and the 22-year record is positive and era-stable. The drawer also shows the equity strip and lets you scroll every historical trade, so you can see the edge is not built on one lucky stretch. From here, two buttons open the symbol in Charts or the Backtester.
One thing to keep in mind: even a 69.1% win rate means roughly one trade in three still lost. The edge is real, but it is an edge over many trades, not a guarantee on this one.
Step 3: Check Charts
Open Charts to see the trigger in context. The candle chart carries EMA 8/21/34 and SMA 50/200 toggles, timeframe tabs, and a squeeze row per timeframe below price. The gold trigger arrow is marked under the trigger candle on the daily timeframe.
Here we confirm what the row implied: price sits in a stacked uptrend, the daily squeeze row is still showing compressed dots (not fired), and momentum has just turned up from below zero. That last part is the Slingshot Squeeze definition: momentum turning up while the squeeze is still on, in a stacked uptrend, with Edge Signal confirmation. If the squeeze row had already flipped to green, we would be too late, because the fire is the exit, not the entry.
Step 4: Enter on the trigger, while the squeeze is on
This is the most important timing rule on the platform, so it gets its own image.
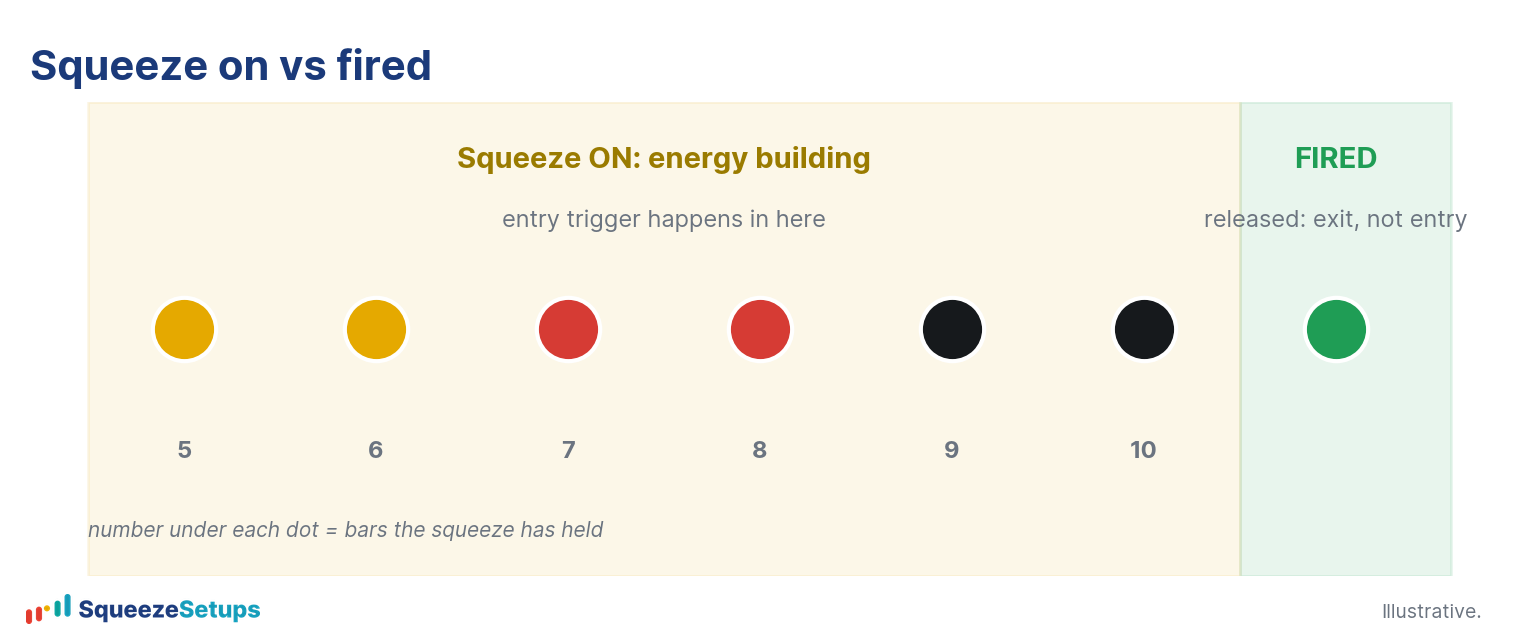
We enter EXMPL on the daily trigger candle while the daily dot is still yellow or red. The squeeze being “on” is the whole edge: we are getting in before the release, not chasing it after. Buying the first green dot historically wins about 54.8%, barely above random, which is exactly why we do not wait for the fire to enter.
Step 5: Manage the trade
Holds in our daily Slingshot backtest average about 13 days, so this is a swing, not a scalp. Two findings shape how we sit through it.
| What we watch | What the backtest says |
|---|---|
| Early pullback against us | Average adverse excursion is about 1.6 ATR; some heat is normal before a winner works. |
| No pullback at all (a runner) | About 46% of long signals never pull back 1 ATR; those runners won about 92% historically. |
| The Ext column climbing | Price stretching far above its mean (high Ext, in ATRs) is a sign the move is maturing. |
In practice: do not panic on the first 1 to 1.6 ATR of heat, and do not bail early on a strong runner just because it is green. The board, drawer, and Reports all keep showing the runner chip and the Ext reading so you can manage the position day to day.
Step 6: Exit on the fire
The exit is the green fire. When the daily squeeze dot for EXMPL flips to green (Fired), the compression has released and the trade has done its job. In our daily Slingshot record that full cycle, enter on the trigger and exit on the release, is what produced +0.93% average per trade across 5,852 trades. You can confirm the closed result later in Reports, which logs each closed trade in its end-of-day recap.
That is the whole loop: a positive-edge row with a live trigger and confluence, confirmed in the drawer and on the chart, entered while the squeeze is on, managed through normal heat, and closed when it fires. The same six steps apply to every setup.
Squeeze Setups is an educational research tool, not financial advice.
Related: The Symbol Drawer, The Daily Routine, How to Trade the Squeeze