How to Trade the Squeeze: A Practical Walkthrough
Key takeaways
- A bare squeeze entry won ~53.9% in our 22-year backtest, no better than a random day (~53.7%). The squeeze alone is not an edge.
- Adding three filters changes the picture: the Slingshot Squeeze won 69.1% (+0.93% avg/trade, 5,852 trades) and the Squeeze Signal won 67.4% (+0.71%, 4,496 trades) on the daily timeframe.
- The workflow is the same every time: find a squeeze, confirm trend and momentum, enter on the trigger while the squeeze is still on, manage, and exit on the fire.
- The green fire is the exit, not the entry. One trade in three still lost.
Trading a squeeze is not about spotting the squeeze. It is about what you require before you enter. A squeeze tells you a stock is compressed and may be about to move, but it does not tell you which way. Our 22-year test of 614 stocks (daily data, 2004 to 2026) found that buying into a bare squeeze won ~53.9% of the time, essentially the same as buying a random day (~53.7%). Waiting for five dots (~54.1%) or the first green dot (~54.8%) made little difference, and pullback entries to the 34 EMA (~45.5%) or 50 SMA (~44.4%) were worse than random. The edge comes from layering trend and momentum filters on top of the squeeze. Here is the full workflow we follow.
Step 1: Find a squeeze on the Squeeze Board
Start on the Squeeze Board, which shows one ranked row per stock. The SQUEEZE MATRIX column gives you one dot per timeframe, and each dot carries three pieces of information:
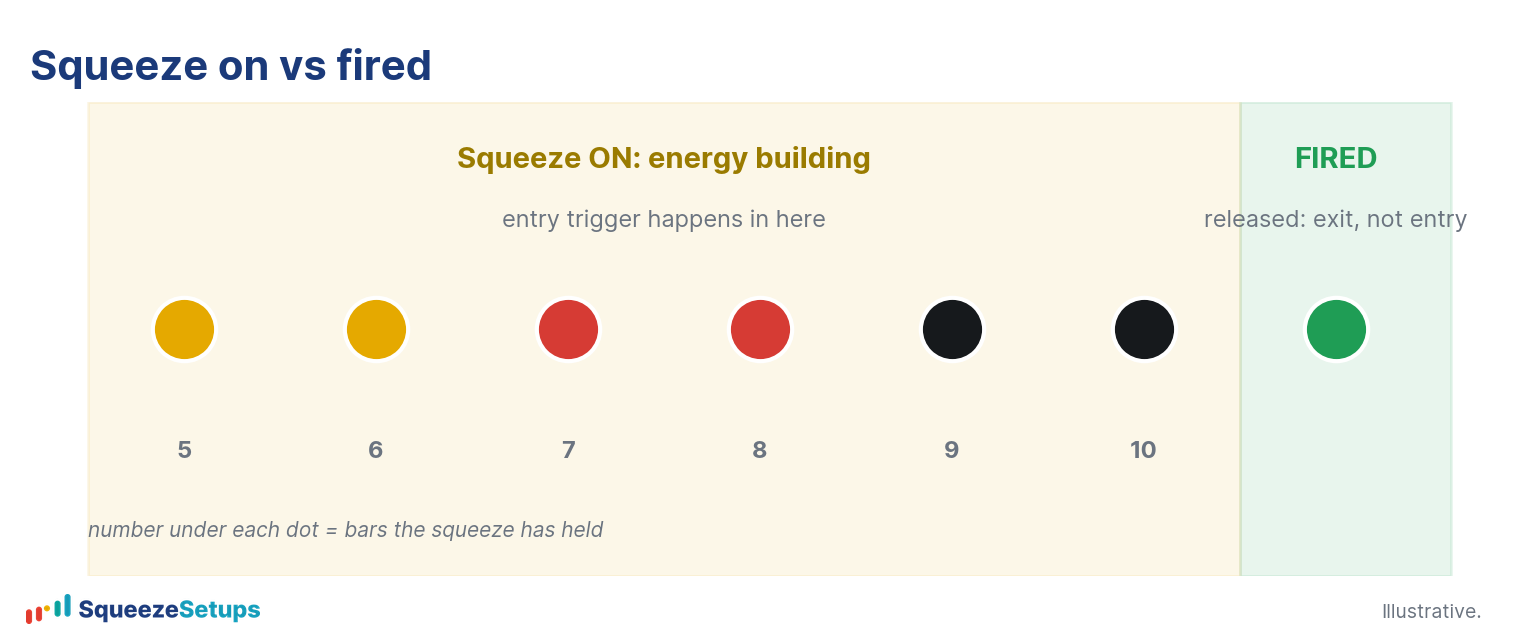
- Color is the tier: yellow = Tight and tightest, red = Mid, black = Loose and loosest, green = Fired.
- The number on the dot is how many bars the stock has been in the squeeze.
- A small triangle shows momentum direction.
The TFs column tells you how many shown timeframes are squeezing at once, for example 5/5. To narrow the field fast, use the Multi-TF Squeeze or Positive Edge tabs, or the filter row (tier, with a signal, fired today, min expectancy).

Step 2: Confirm trend and momentum
A squeeze is only the first of three pillars. The other two are what separate the 53.9% bare-squeeze result from a real edge.
Trend. We require a stacked uptrend: EMA 8 above 21 above 34. The board’s Stack column shows how many days that bullish stack has held. We are long-biased by default. Short Slingshot setups won 60.3% historically but carried negative expectancy (about -2.0% per trade), so we only consider shorts on names with a positive per-symbol short record.
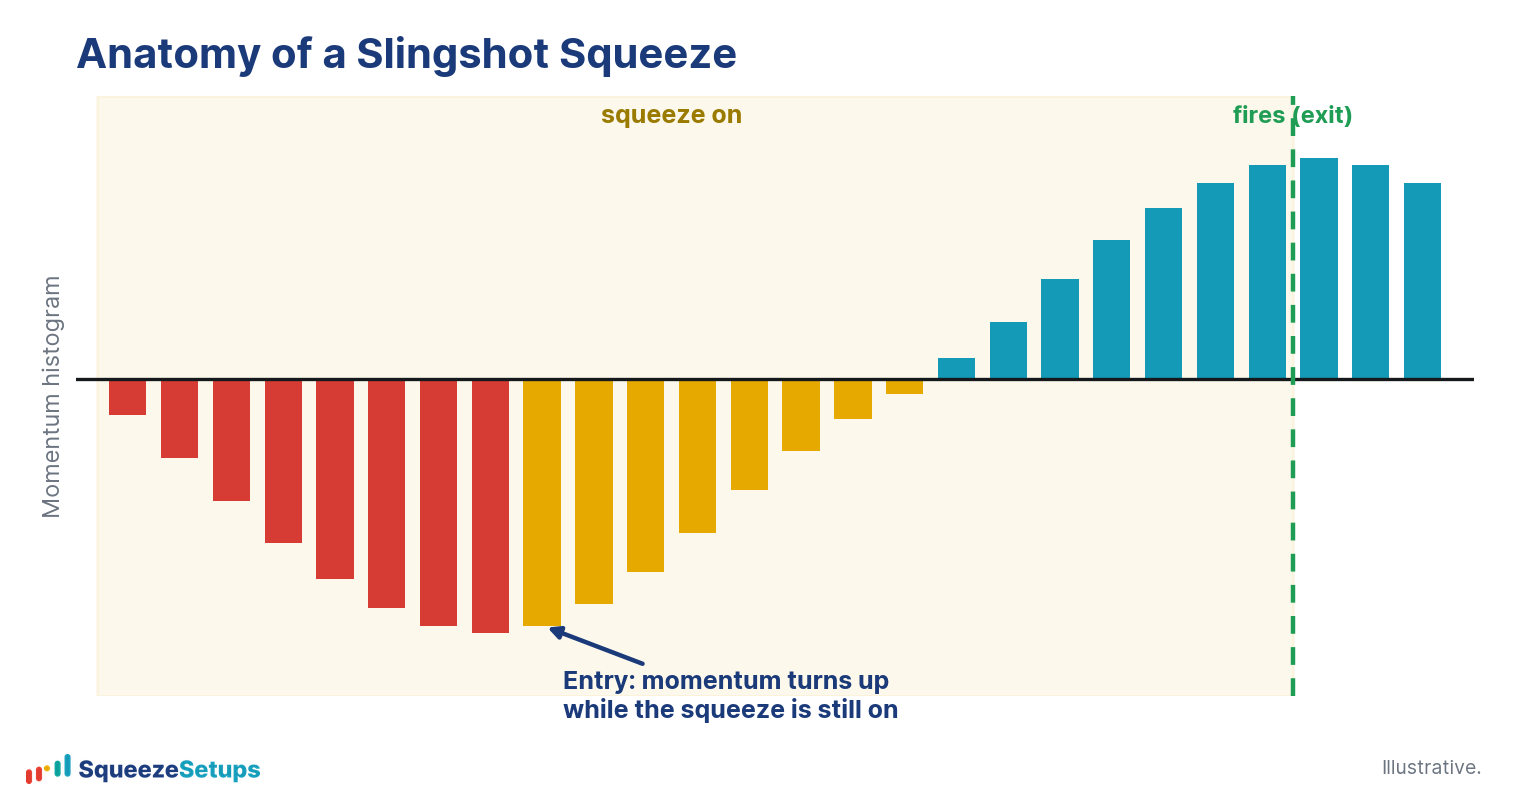
Momentum. For the Slingshot Squeeze, momentum should be turning up from below zero while the squeeze is still on. For the Squeeze Signal, momentum is already above zero and the compression tightens a tier (a continuation). Both setups add Edge Signal confirmation as a named layer on top. Click any row to open the Symbol drawer, which scores all three pillars (trend stacked, timeframe confluence, positive backtest) and gives a plain-language verdict plus the full 22-year record.
Step 3: Enter on the trigger while the squeeze is ON
This is the step that is easy to get backwards. You enter on the trigger arrow while the squeeze is still on, not when it fires. On the board, a gold arrow in the Trigger column is a Slingshot Squeeze and a cyan arrow is a Squeeze Signal, each labeled with its timeframe. The Status column reads “in squeeze” at entry time.
The daily timeframe is where the edge is strongest and validated. Expectancy per trade falls off as you go shorter:
| Timeframe | Slingshot expectancy / trade |
|---|---|
| Daily | +0.93% |
| 4h / 240m | +0.56% |
| 30m | +0.51% |
| 195m | +0.44% |
| 130m | +0.41% |
| 78m | +0.18% |
| 2h / 120m | +0.15% |
| 1h / 60m | +0.10% |
| 39m | +0.06% |
| 5m | +0.01% |
| 15m | about -0.04% |
For the Squeeze Signal, only the daily timeframe is validated so far; the intraday backtest is still in progress.
Step 4: Manage the trade
Two facts from the backtest shape how we manage:
- The typical hold is short: about 13 days for the Slingshot Squeeze and about 15 for the Squeeze Signal.
- Runners matter. Roughly 46% of long signals never pulled back a full 1 ATR, and those runners won about 92% (era-stable). The average adverse excursion was about 1.6 ATR, so a stop placed too tight cuts off exactly the trades that would have run.
Use the board’s Ext column (how far price is above its mean, in ATRs) and MP column (Market Pulse: Acceleration, Accumulation, Distribution, or Deceleration) to read whether the move still has room or is stretching.
Step 5: Exit on the fire
The green dot, the “Fired” status, is the exit. It signals the squeeze has released, not that you should buy. Entering on green is one of the bare-squeeze approaches that showed no edge. The clear separation between an active squeeze and a fired one is the difference between an entry and an exit.
Does this actually hold up?
Across our 22-year window, the Slingshot Squeeze won 66.8% to 70.9% across five separate market eras, and the Squeeze Signal held 64.9% to 71.3%. That stability is the reason we trust the workflow over any single trade. But it is still a probability game: one trade in three lost, and these figures are historical backtests before commissions and slippage, never a forecast. Before risking anything, pull a name into the Backtester to confirm it has a positive per-symbol record on the setup and timeframe you intend to trade.
Please note: This research is based on historical backtest data. It is NOT a prediction, and it is NOT financial advice.
Related: How to read the Squeeze Board, The Slingshot Squeeze explained, Why a bare squeeze has no edge.
Practice it: the Squeeze stock market game
Read real squeeze charts with the symbol hidden, call long, short or pass, and see what happened. Free, ten new charts every day. Play the Squeeze stock market game