Backtesting the Squeeze: 22 Years, Per Symbol
Key takeaways
- We backtest every one of our 614 stocks on its own daily history, 2004 to 2026, with one fixed rule set: enter on the trigger while the squeeze is on, exit when it fires.
- Edge is name-specific. A setup that wins on one symbol can be a coin flip on another, so we never average a “market-wide” win rate and call it your edge.
- Holding the exit constant is what makes the numbers comparable across symbols, timeframes, and 22 years.
- These are historical backtests before commissions and slippage, long-biased by default, and never a forecast.
Most squeeze “stats” you see are one number stretched across the whole market. We do the opposite: we run the same mechanical rules against each symbol’s own 22-year daily history, store every trade, and report that symbol’s record by itself.
The result is a per-symbol record you can read off the board before you risk anything, rather than a blended average across names that may behave very differently.
What exactly do we hold constant?
A backtest is only honest if the rule that closes a trade never moves. Ours does not. For both setups, entry is the trigger fired while the squeeze is still on, and the exit is the fire (the green dot).
The green fire is the EXIT, not the entry. We do not optimize a target, trail a stop, or pick a “best” hold per symbol after the fact. If the exit is fixed, then the only thing that varies between two symbols is the symbol, which is what we are trying to measure.
The two setups we test:
| Setup | Entry condition | Daily record (all 614) |
|---|---|---|
| Slingshot Squeeze | Momentum turns up from below zero while the squeeze is still on, in a stacked uptrend, with Edge Signal confirmation | 69.1% win, +0.93% avg/trade, 5,852 trades, ~13 day hold |
| Squeeze Signal | Continuation: momentum already above zero and the compression tightens a tier, with Edge Signal confirmation | 67.4% win, +0.71% avg/trade, 4,496 trades, ~15 day hold |
Daily is what is validated today. The intraday Squeeze Signal backtest is still in progress, so we do not publish intraday Squeeze Signal numbers as edge yet.
Why per symbol, not market-wide?
Because the edge is name-specific. Entered generically on any symbol, none of the obvious squeeze variants beats a random trading day (53.7%):
- Bare squeeze (the moment compression appears): about 53.9%.
- Waiting for five dots: ~54.1%.
- Buying the first green dot: ~54.8%.
- Pulling back to the 34 EMA: ~45.5%, actually worse than random.
None of that is a tradable edge on its own. The added win rate comes from confluence and from the specific symbol’s history, and you cannot see the second part unless you measure each symbol separately.
That is why the board reports a 22-Yr Backtest column per row (n trades, Win %, Net %, Exp) and why the short side is handled per symbol too: the short Slingshot wins 60.3% of the time yet carries NEGATIVE expectancy, about -2.0% per trade, and only earns its place on names with a positive per-symbol short record.
We are long-biased by default for exactly this reason.
A market-wide average would have buried that sign flip.
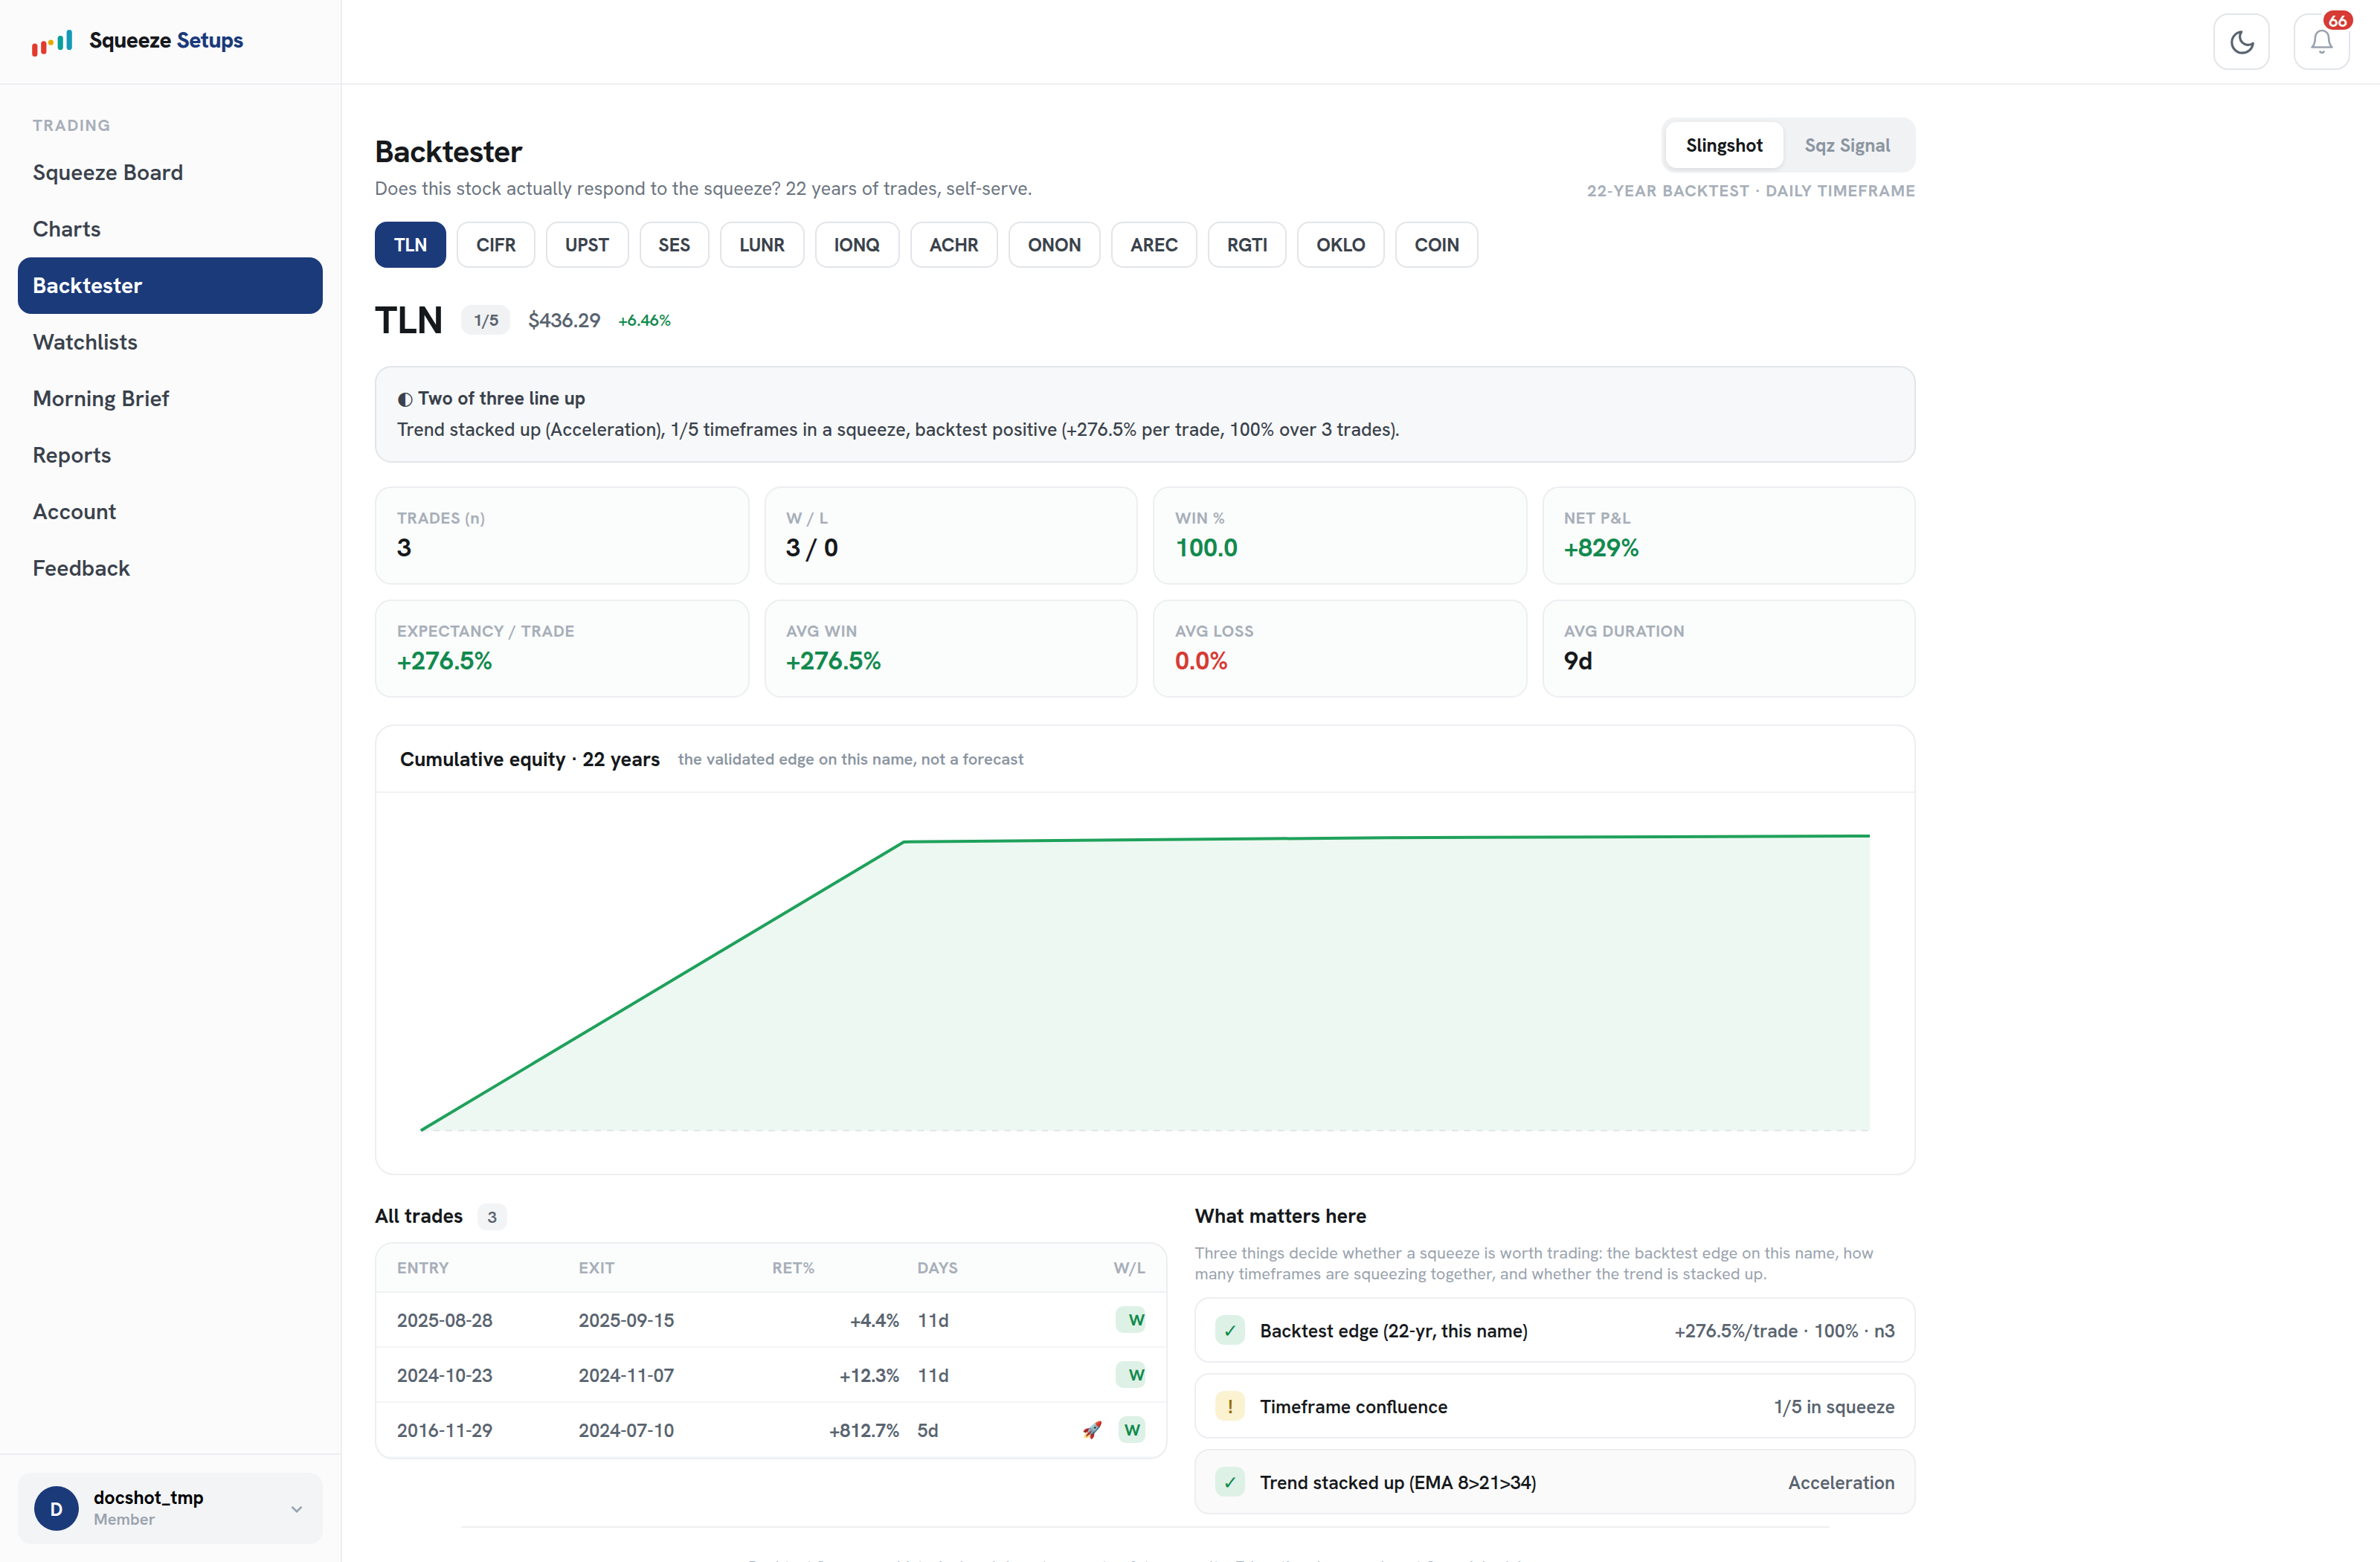
You can reproduce any of this yourself. In the Backtester, type a symbol, toggle Slingshot or Squeeze Signal on the daily timeframe, and you get trades (n), W/L, Win %, Net P&L, Expectancy/trade, average win, average loss, average duration, the full trade list, and the 22-year cumulative equity curve.
The “What matters here” panel ties that record back to the three pillars: backtest edge, timeframe confluence, and the EMA 8>21>34 trend stack.
Does the edge survive across 22 years?
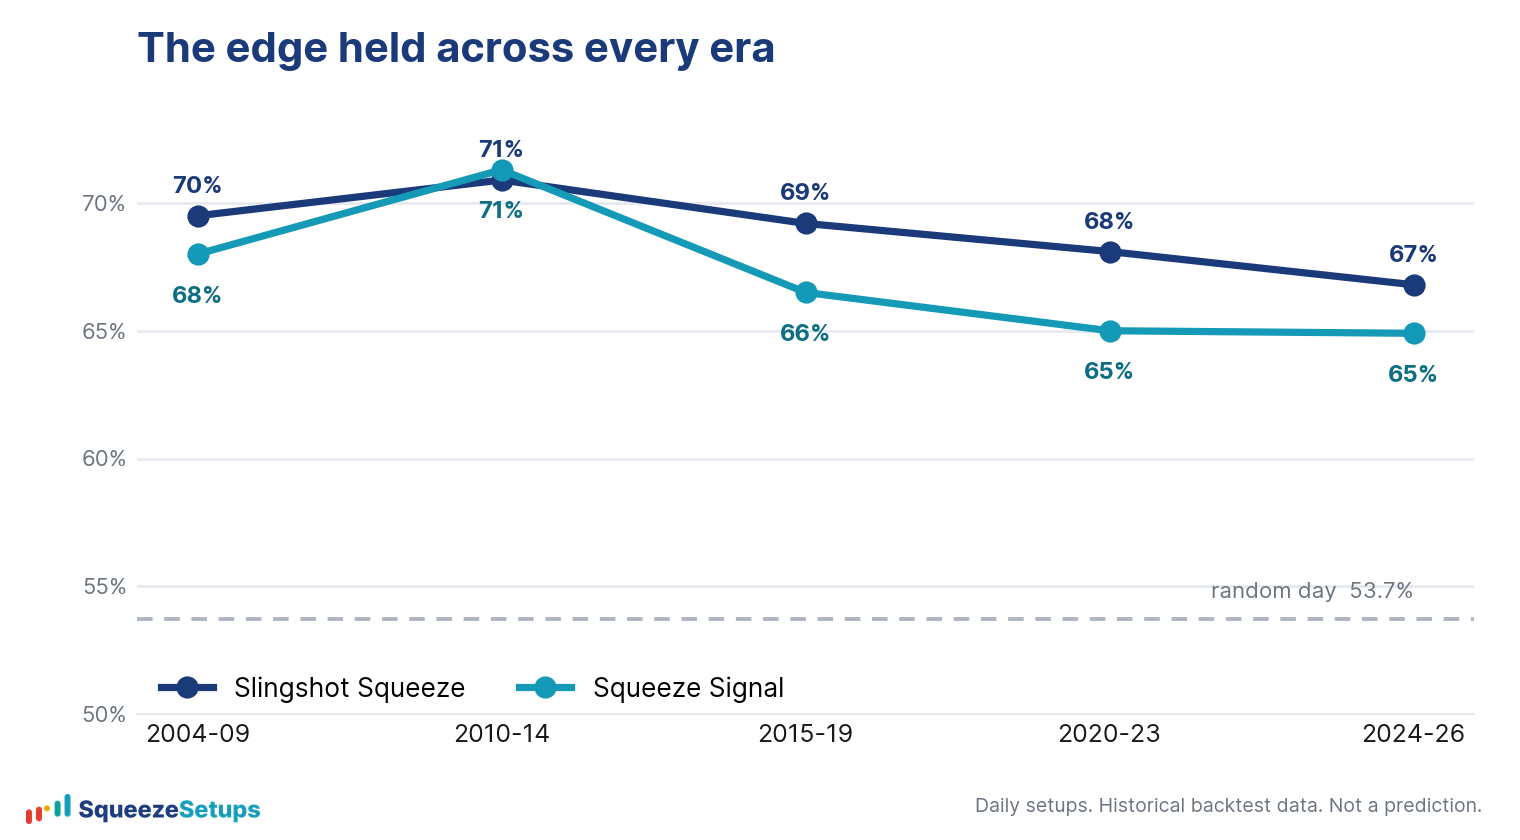
A single big number can be one lucky decade. So we split the 22 years into five eras and check whether the win rate holds in each. It does.
The daily Slingshot Squeeze stays in a band of 66.8% to 70.9% across all five eras; the daily Squeeze Signal holds 64.9% to 71.3%. The setup is not riding one regime.
The era check also measured how trades behave after entry. About 46% of long signals never pull back a full 1 ATR after entry; those won roughly 92%, and that held across eras too.
The average adverse excursion was about 1.6 ATR, so the winners can run, but you sit through real drawdown to hold them.
Reading the cumulative curve honestly
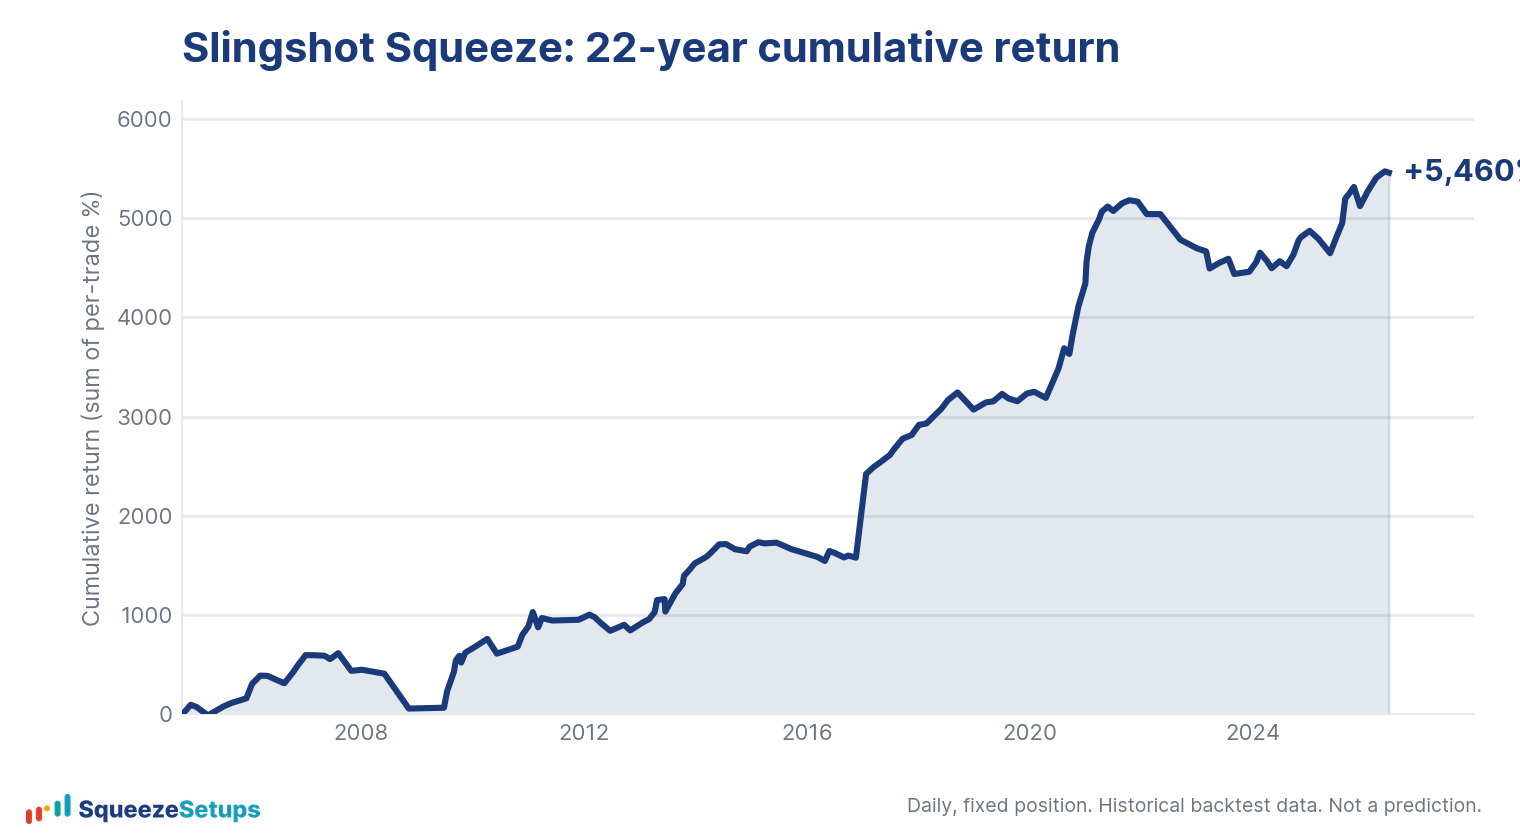
Stacked across all qualifying trades at a fixed position size, the daily Slingshot Squeeze compounds to roughly +5,460% over the 22 years, and the daily Squeeze Signal to about +3,188%. Those curves are the sum of thousands of small, fixed-rule trades, not a few home runs.
They are easy to misread, so read them with the caveats below.
The limits we will not hide
Three things keep these numbers from being a promise:
- Before costs. Every figure is before commissions and slippage. Real fills shave the edge, and the thinner per-trade expectancies feel it most.
- Long-biased. The validated edge is the long side on daily data. Shorts are off by default unless a symbol’s own short record earns them.
- One trade in three still lost. A 69% win rate means roughly 31% of trades were losers. The edge shows up across many trades, not on any single one.
And timeframe matters: daily carries the strongest expectancy per trade (+0.93%), with the intraday Slingshot tapering down through the shorter frames and 15m actually slightly negative (about -0.04%). That is why the board and Backtester default to what we have validated rather than to whatever timeframe looks busiest.
Please note: This research is based on historical backtest data. It is NOT a prediction, and it is NOT financial advice.
Related: Does the squeeze actually work?, The Backtester, Which stocks squeeze well?