The Symbol Drawer, Explained
Goal: Use the symbol drawer to confirm or reject a setup before you act on it.
You need: The Squeeze Board open, and one row that caught your eye (a trigger arrow, a strong matrix, or a name on your watchlist).
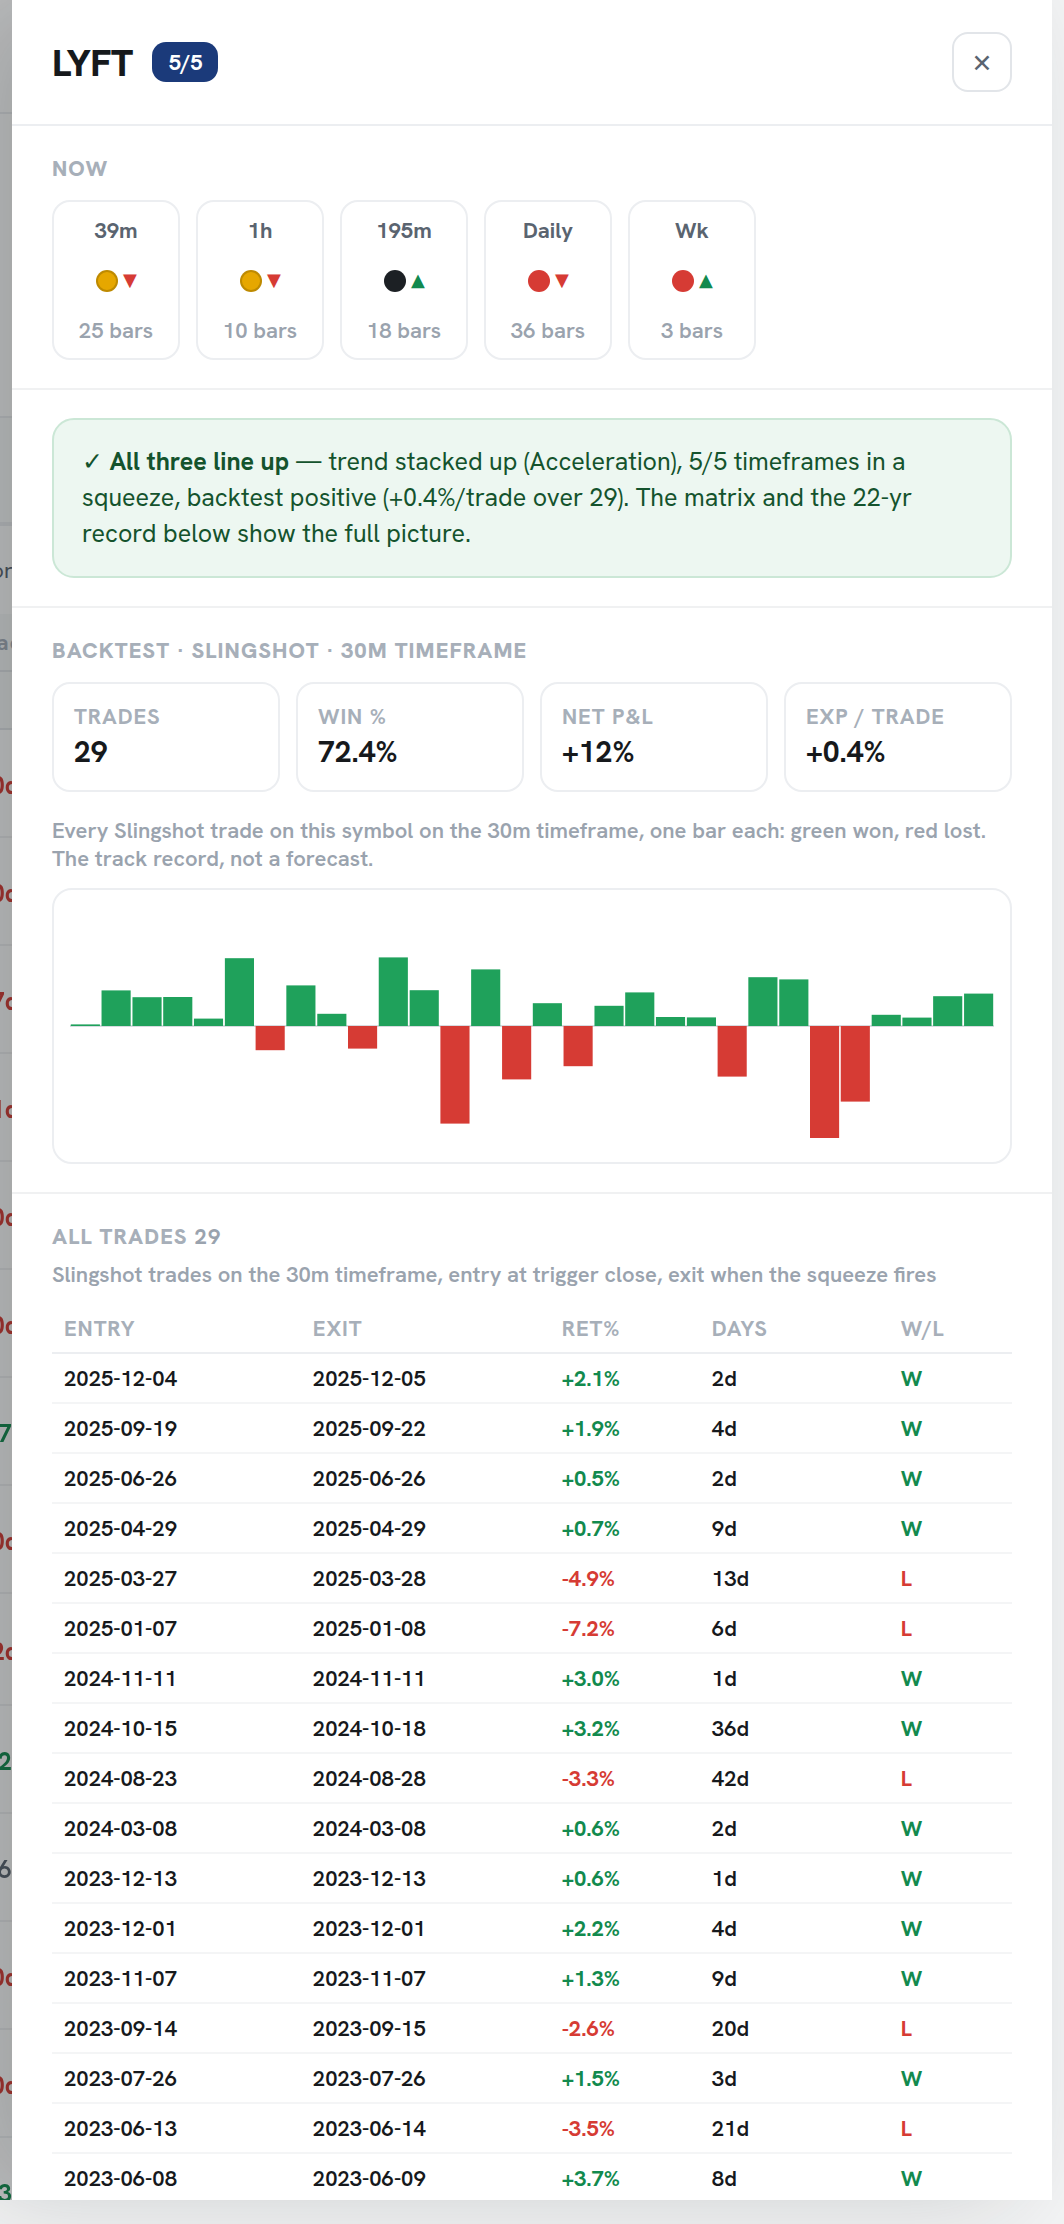
Click any row on the Squeeze Board and a drawer slides out. It collects the case for a stock in one place: a plain-language verdict, the full 22-year record, and two buttons that open the Charts or the Backtester. The board tells you what is happening right now; the drawer tells you whether it has ever paid to act on it.
What is the verdict at the top?
The first thing the drawer shows is a plain-language verdict, scored against our three pillars. These are the same three things the board uses to rank every row, stated in words instead of columns:
- Trend. Is the EMA stack bullish (8 above 21 above 34)? A stacked trend means buyers are in control. The drawer says whether the stack is intact and how long it has held.
- Timeframe confluence. How many shown timeframes are in a squeeze at once? More timeframes compressed together is a stronger, more aligned setup than a single dot.
- Backtest edge. Does this specific symbol have a positive 22-year record on the active setup? A positive record is what separates a setup worth taking from a chart that only looks the part.
When all three pillars line up, the verdict reads as a clear yes. When one is missing, the verdict says so directly: a strong-looking squeeze on a symbol with a losing per-symbol record gets flagged. The point of the verdict is to stop you from acting on the picture alone.
Why does the per-symbol record matter so much?
Because the bare picture is close to a coin flip. Entering on a squeeze with no other filter wins about 53.9% of the time, which is no better than a random day (53.7%). The edge does not live in the squeeze itself; it lives in the combination of three things:
- A stacked trend.
- Timeframe confluence.
- A symbol whose own history rewards the setup.
That is why the drawer leads with the verdict and then backs it with the record, rather than just showing you the dot.
The two named setups are where the numbers get strong, and the drawer reports the active one for this symbol:
| Setup (daily) | Win rate | Avg per trade | Trades | Avg hold |
|---|---|---|---|---|
| Slingshot Squeeze | 69.1% | +0.93% | 5,852 | ~13 days |
| Squeeze Signal | 67.4% | +0.71% | 4,496 | ~15 days |
Those are universe-wide figures across 614 stocks. The drawer shows you the record for this symbol, which is the number that should drive your decision. A name can sit well above or below the average, and one trade in three still lost even on the strong setups.
How do I read the 22-year record and equity strip?
Below the verdict, the drawer lays out the symbol’s complete history on the active setup: the win rate, an equity strip, and every individual trade. The equity strip is a compact cumulative curve, the running result of taking this setup on this symbol from 2004 to 2026. You are looking for two things.
First, the slope. A line that rises steadily up and to the right is what an edge looks like. Second, consistency. Our universe-wide win rate for the Slingshot Squeeze holds between 66.8% and 70.9% across five separate market eras, and the Squeeze Signal holds between 64.9% and 71.3%. On the symbol level you want to see the same thing: an edge that did not come from a single strong year. If the strip is flat or jagged, or all the gains are bunched into a single stretch, that is a reason to pass even when the dots look perfect.
The trade list under the strip is every entry and exit the backtest took. Remember that for both setups the entry is the trigger while the squeeze is still on, and the green fire is the exit, not the entry. Scanning the list tells you the rhythm of the name: how often it triggers, how long it holds, and how deep the losers ran.
What do the Charts and Backtester buttons do?
Two buttons at the bottom of the drawer take you deeper without losing the symbol.
- Open in Charts drops you onto the candle chart for this symbol, with the EMA 8/21/34 and SMA 50/200 toggles, timeframe tabs, and a squeeze row per timeframe below price. The trigger arrow is marked under the trigger candle on the trigger’s timeframe, so you can see exactly where the setup fired and what price did next.
- Open in Backtester sends the symbol straight into the Backtester, where you can toggle Slingshot or Squeeze Signal and read the full stat sheet: trades, W/L, win %, net P&L, expectancy per trade, average win, average loss, average duration, the equity curve, the complete trade log, and a “What matters here” panel of the same three pillars.
The drawer is the fast read; these two views are the slow read. Use the drawer to decide whether a name is worth more of your time, then click through to confirm on the chart and stress-test in the Backtester.
A quick way to use it
When a row catches your eye, open the drawer and ask the three pillar questions in order. Is the trend stacked? Are enough timeframes in a squeeze together? Does this symbol’s own 22-year record reward the active setup, with an equity strip that climbs steadily? If all three are yes, the setup is worth taking to Charts. If the verdict flags a missing pillar, trust the flag over the picture. The squeeze alone is a coin flip; the confirmed setup is the edge.
Squeeze Setups is an educational research tool, not financial advice.
Related: How to read the Squeeze Board, The Backtester, How the platform ranks and qualifies setups.