How to Read the Squeeze Board
Goal: go from 600+ stocks to the few worth your attention in seconds.
You need: an active membership. If the squeeze basics are new, read What is the Squeeze? first.
The Squeeze Board scans the universe across every timeframe and ranks it for you, so your job stops being “find a squeeze” and becomes “pick the best one.” Every row is one stock, and each row carries three things: where it is squeezing (the matrix), whether a setup just triggered (the trigger), and what that setup has done historically on that exact name (the 22-year backtest). This guide walks through reading the board from a full list down to a single decision.
Open the Squeeze Board
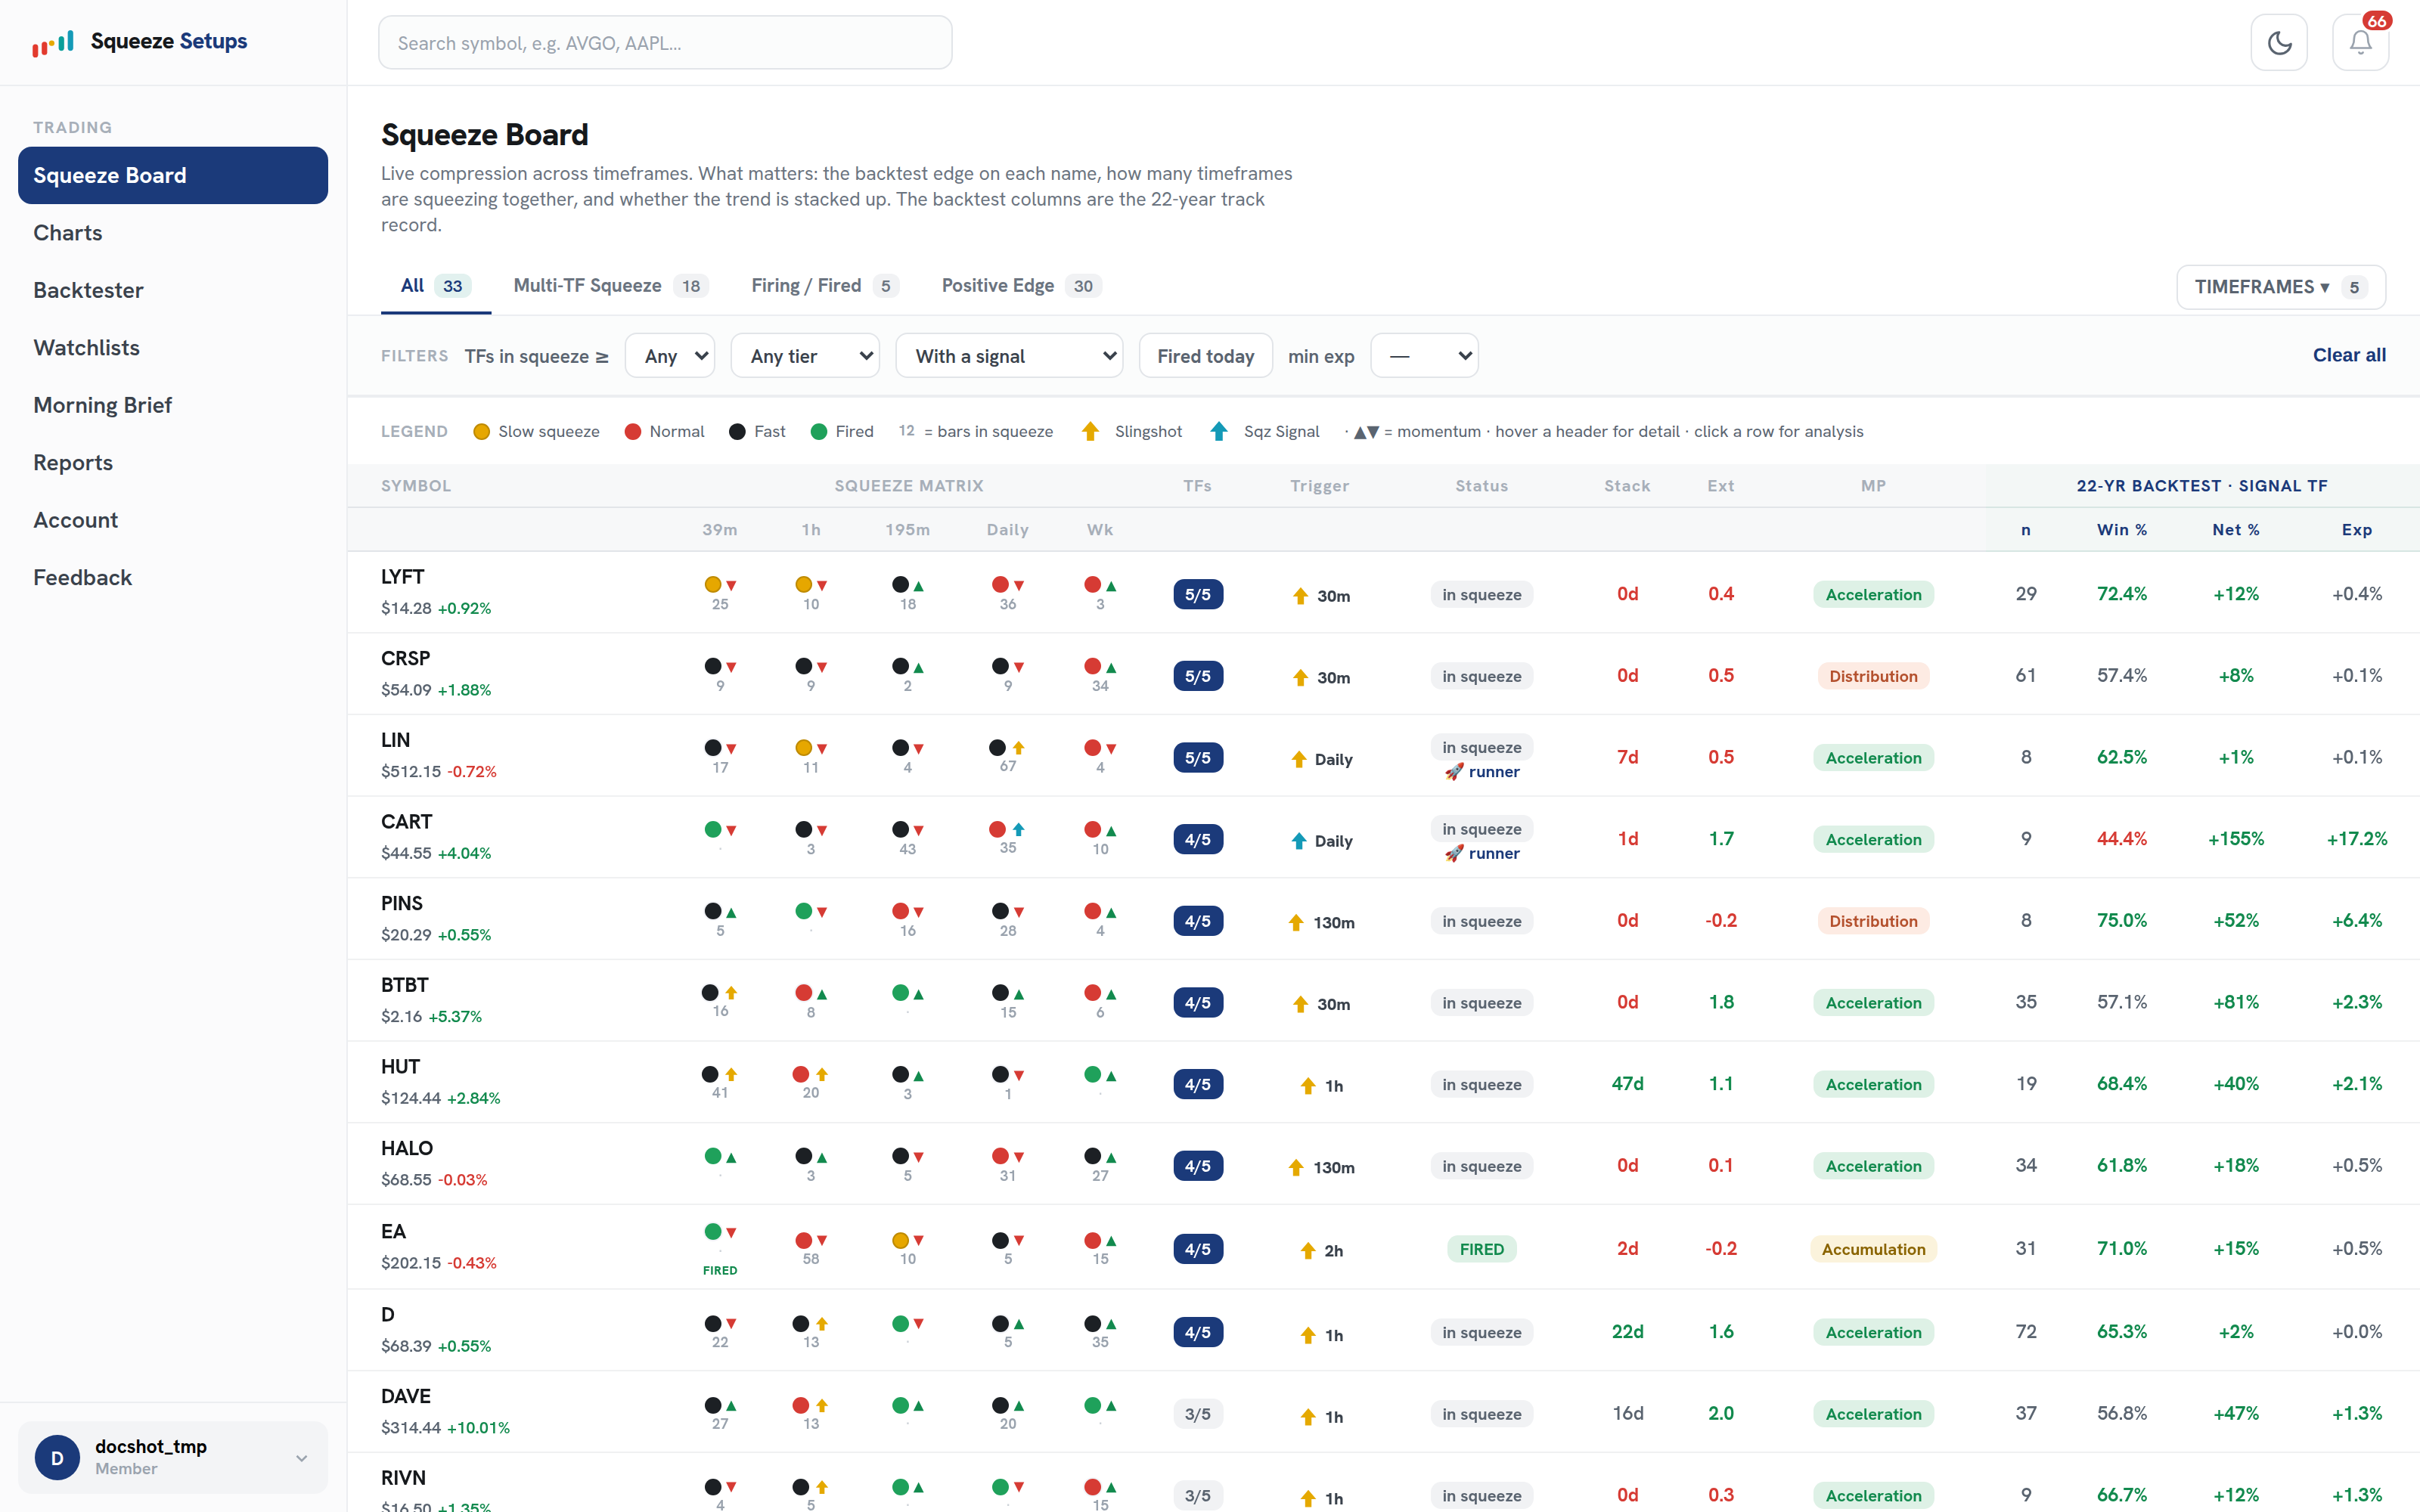
From the left menu, open Squeeze Board. You land on a ranked table, one row per stock, sorted so the strongest live setups sit at the top.
Pick a view, then narrow with filters
The four tabs across the top slice the list instantly. Use them before you touch anything else:
| View | Shows |
|---|---|
| All | The full ranked universe |
| Multi-TF Squeeze | Names squeezing on several timeframes at once |
| Firing / Fired | Squeezes releasing right now |
| Positive Edge | Only setups whose 22-year backtest came back positive |
Below the tabs is the filter row. It narrows whatever view you are in by:
- Tier
- Whether a row has a live signal
- Whether it fired today
- A minimum expectancy
The Timeframes control picks which columns show in the matrix, and Clear all resets everything in one click.

Read a row, left to right
Each row reads left to right. Here is the same row up close:

| Column | What it shows | How to read it |
|---|---|---|
| Symbol | Ticker, last price, and percent change | Your identifier for the row |
| Squeeze Matrix | One dot per timeframe | Color is the tier (yellow tight, red mid, black loose), green means fired, the number is bars in the squeeze, and the small triangle is momentum direction |
| TFs | How many of the shown timeframes are squeezing | Higher means broader confluence. 5/5 means every shown timeframe is in a squeeze |
| Trigger | The live setup firing now and its timeframe | A gold arrow is a Slingshot Squeeze, a cyan arrow is a Squeeze Signal. The same arrow is marked on that timeframe in the matrix |
| Status | Where the squeeze stands | “in squeeze” is still building, “FIRED” released today, and a runner chip means price has extended with no 1-ATR pullback yet |
| Stack | Days the bullish moving-average stack has held | A longer stack is a more established uptrend underneath the squeeze |
| Ext | How far price sits above its mean, in ATRs | Low is room to run, high is extended and prone to a pullback |
| MP | Market Pulse, the trend gate | One of Acceleration, Accumulation, Distribution, or Deceleration |
| 22-Yr Backtest | This name’s record on the signal’s timeframe | Number of trades, win rate, net return, and expectancy per trade, 2004 to today |
The board ranks all of this for you, so a row with a live trigger, several timeframes in a squeeze, a stacked trend, and a positive backtest naturally rises toward the top. That combination is what you are scanning for.
Open a row for the full read
Click any row and the detail drawer slides out. It opens with a plain-language verdict that scores the setup on the three pillars (trend, timeframe confluence, and a backtested edge), then shows the full 22-year record for that name and timeframe: win rate, a green-and-red equity strip, and every trade in the list.
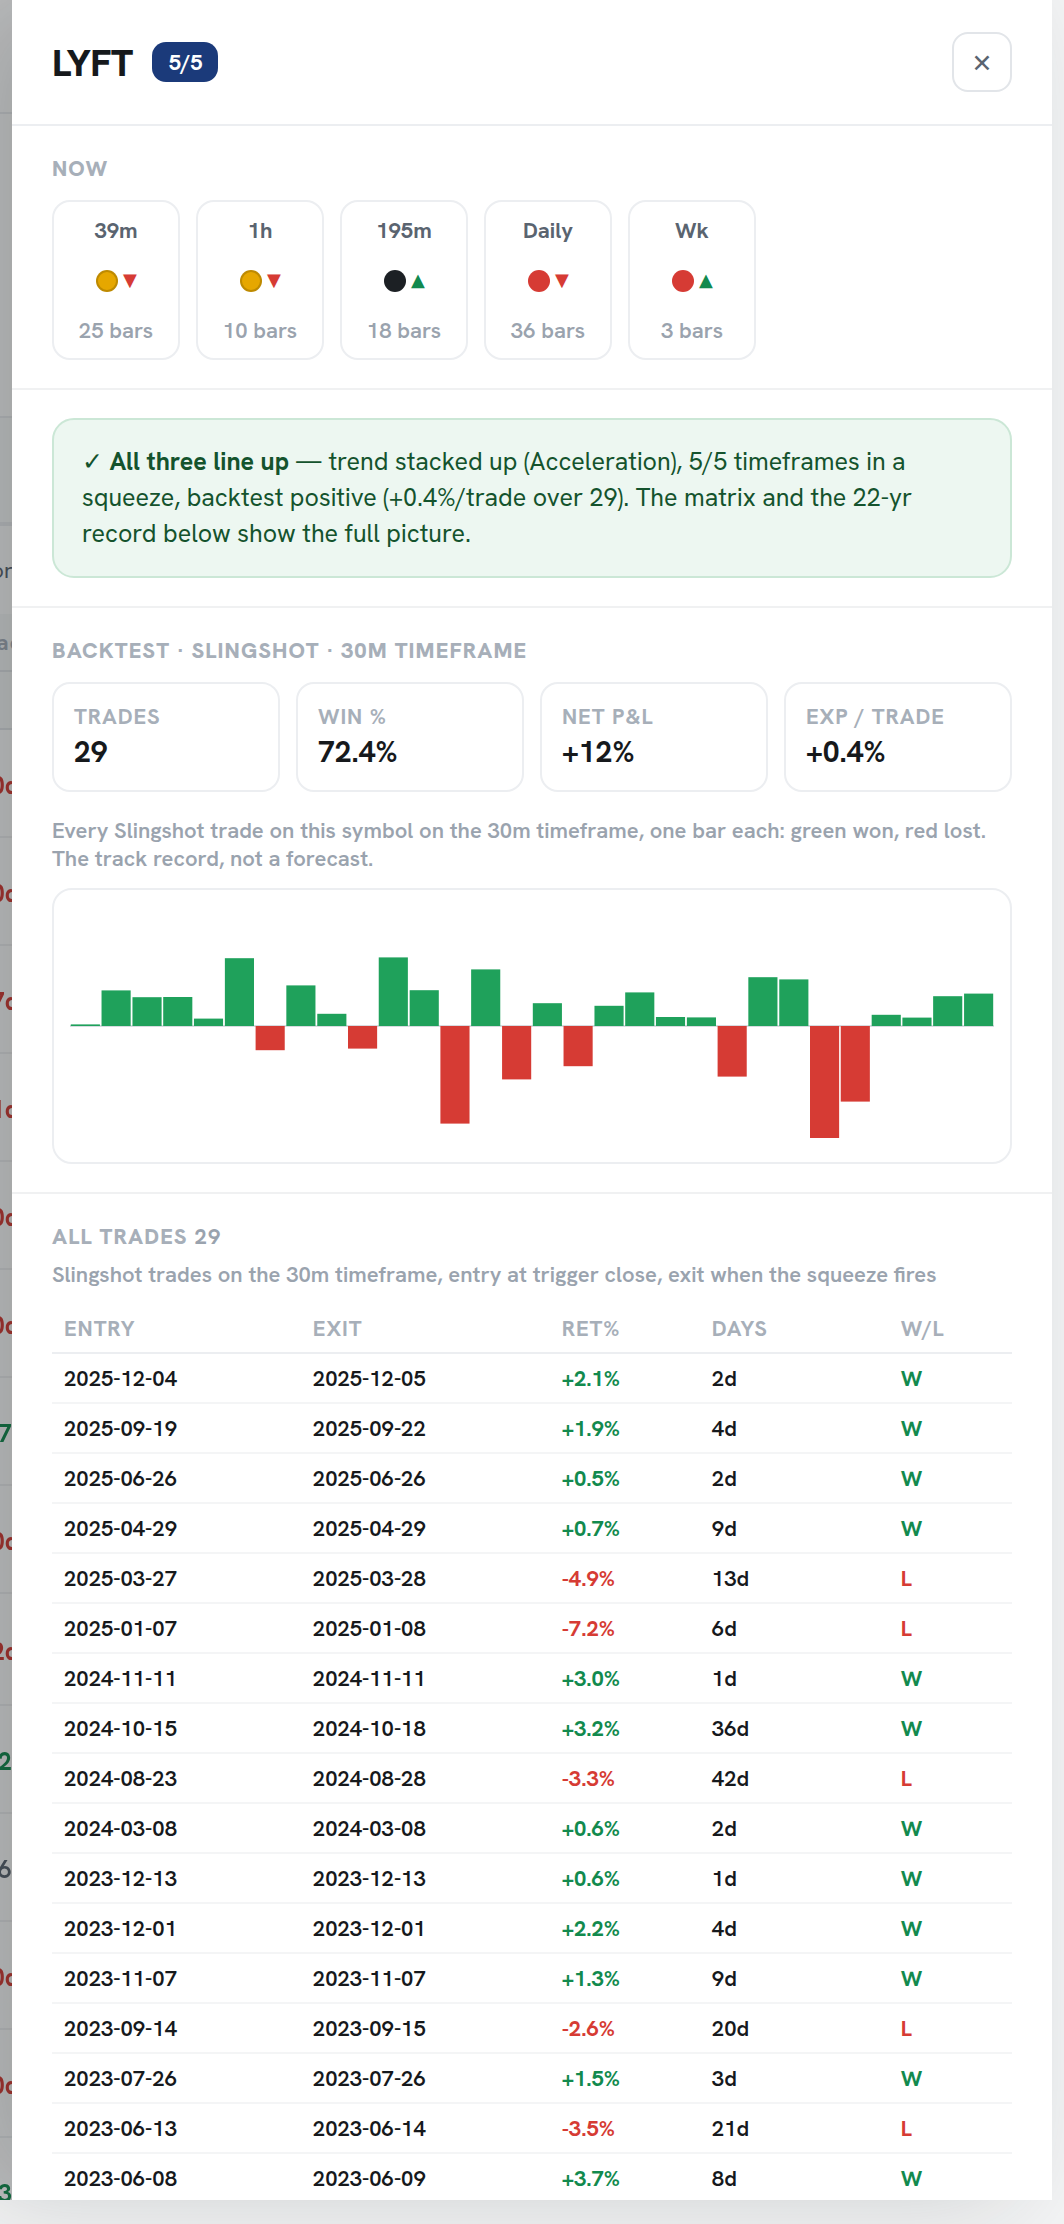
The verdict is the fastest read on the board. “All three line up” means the trend is stacked, several timeframes are squeezing, and the backtest on that name is positive. From here you can open the same symbol in Charts or the Backtester.
See it on the chart
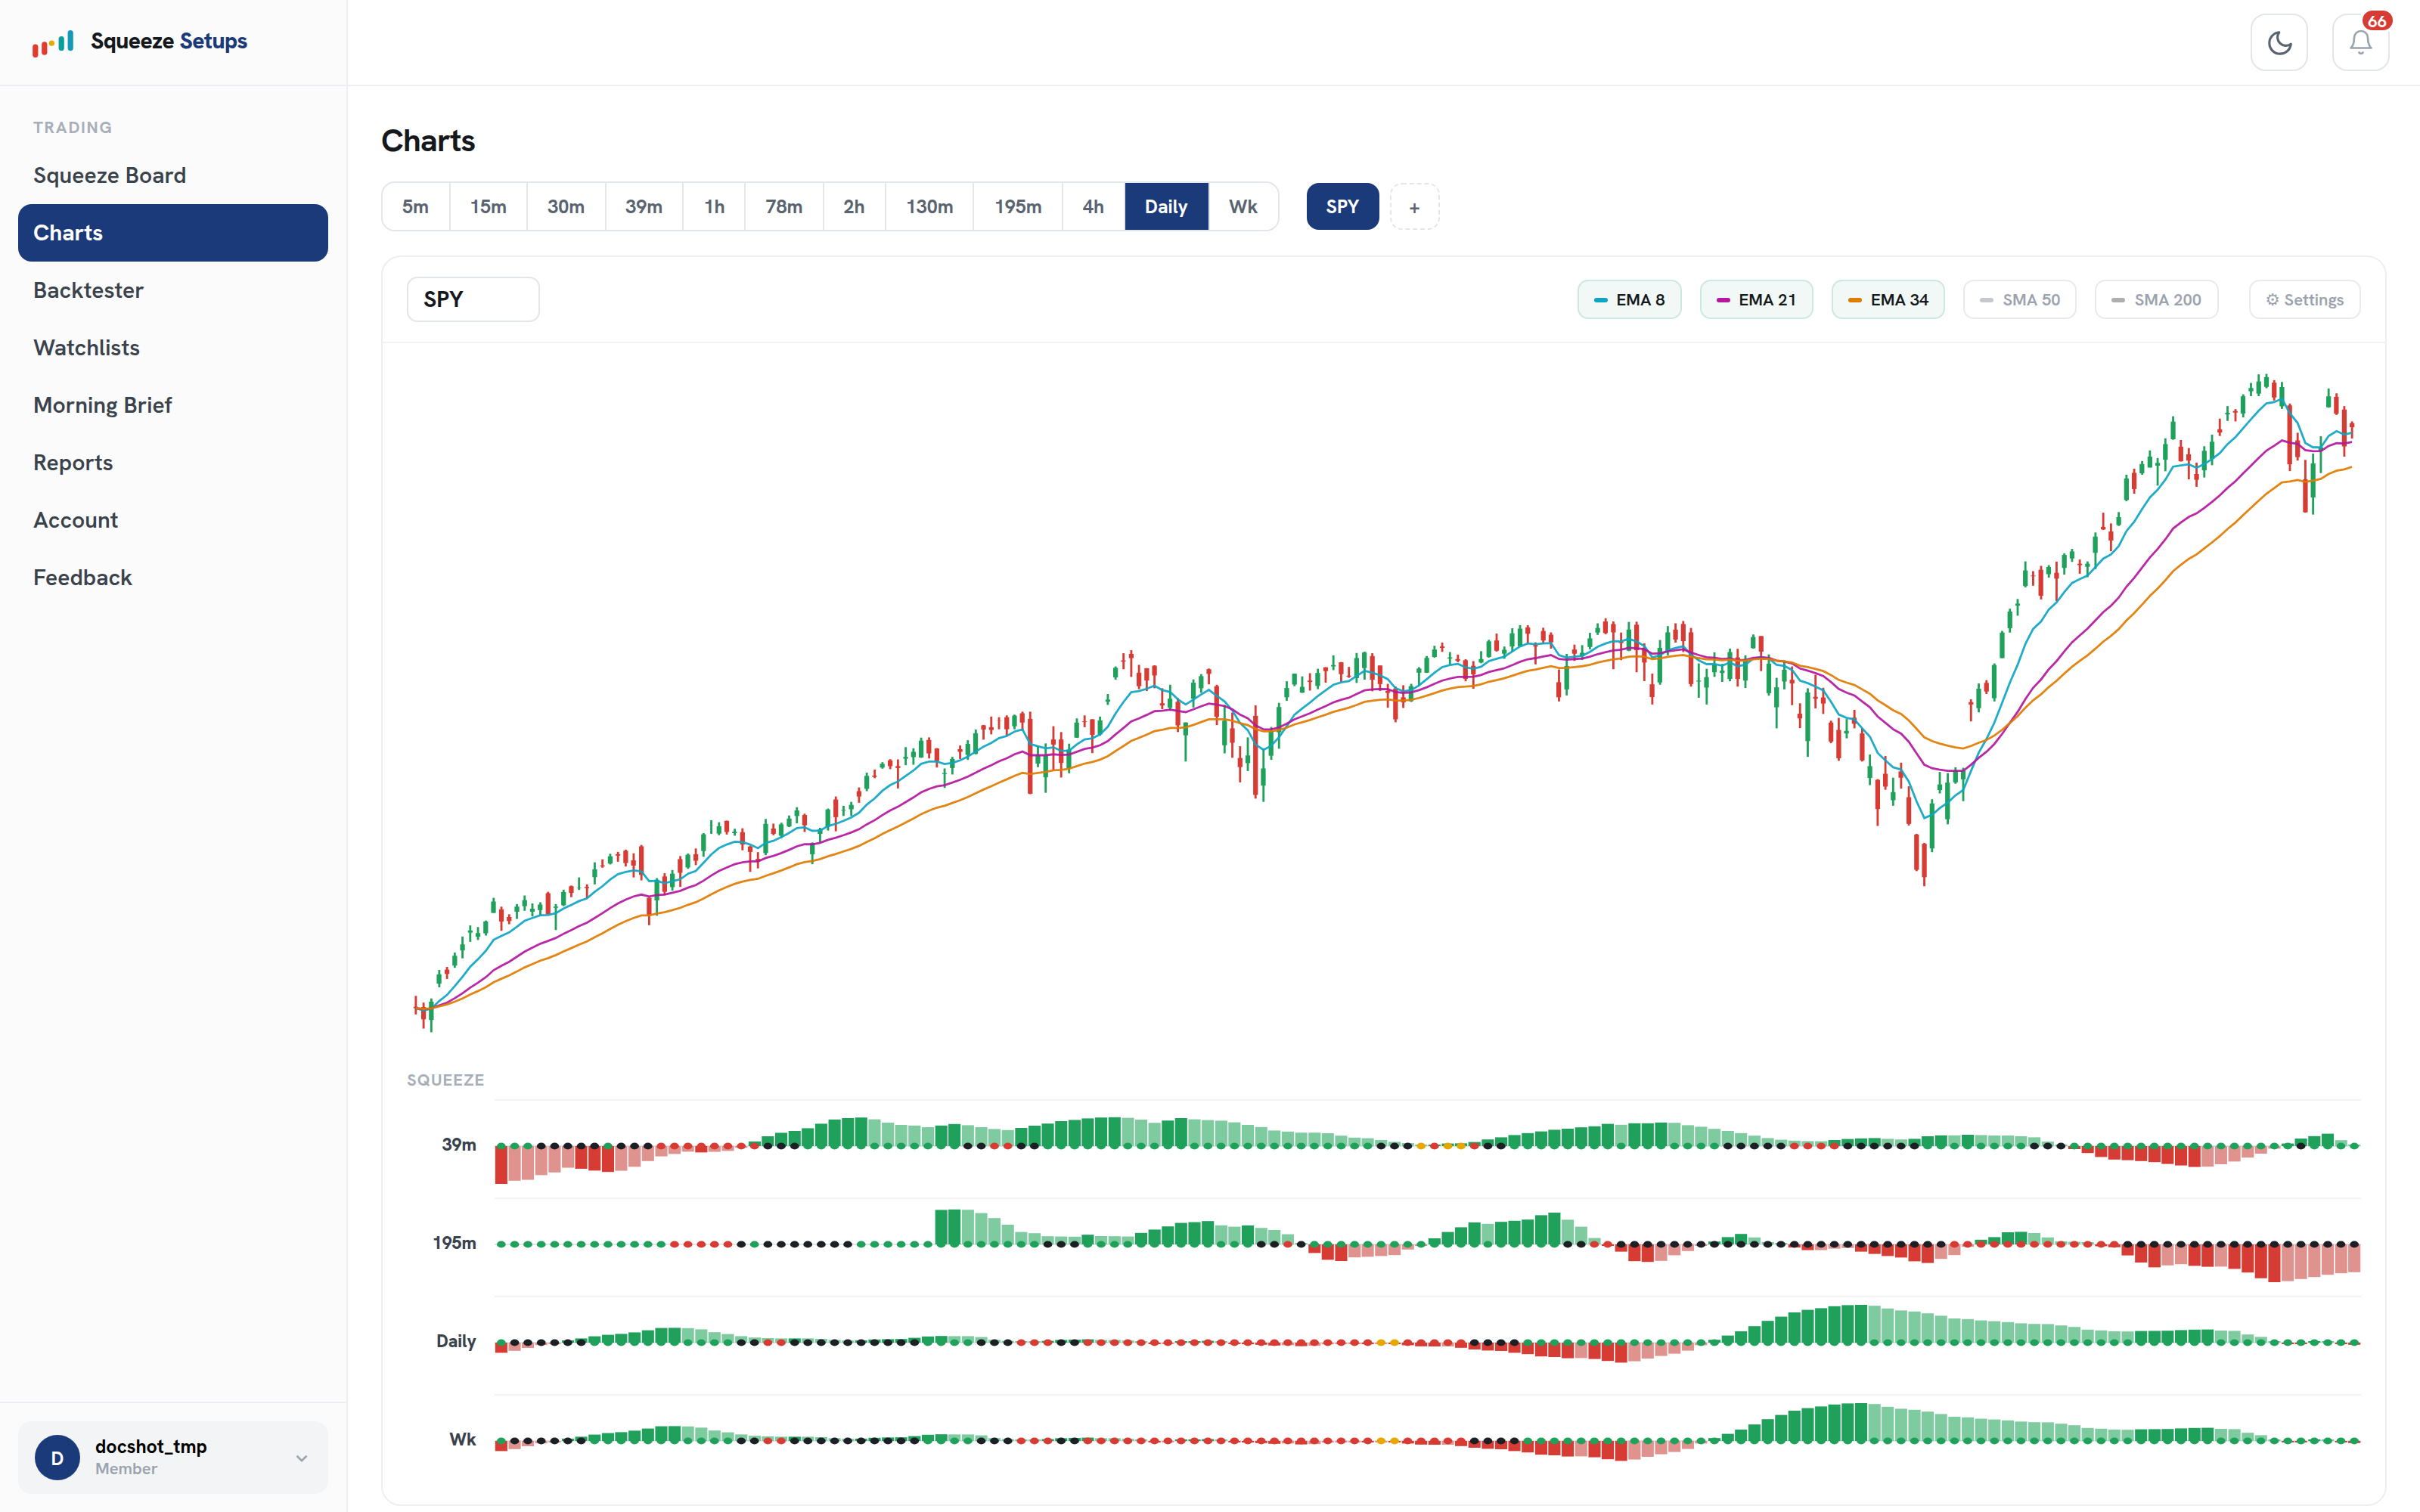
Open the row in Charts and it loads on the trigger’s timeframe with the same arrow marked under the trigger candle, so the board and the chart always agree. Below price, a squeeze row for each timeframe shows the dots and momentum that drive the matrix.
A quick workflow
Once the layout is familiar, the daily read takes seconds:
- Start on Positive Edge (or All if you want the full picture).
- Scan the Trigger column for a live gold or cyan arrow.
- Check that the TFs count is high and the 22-Yr Backtest win rate is positive.
- Click the row and read the verdict to confirm all three pillars line up.
- Open it in Charts to see the trigger on price before you act.
Troubleshooting
- The board looks empty. Your filters are too strict. Click Clear all and start from the All tab.
- No triggers showing. A trigger only appears the moment a setup qualifies on the current bar. Switch to All or Multi-TF Squeeze to see names building toward one.
Squeeze Setups is an educational research tool, not financial advice.
Related: How to set a squeeze alert · The Slingshot Squeeze, explained · Why a bare squeeze has no edge · One squeeze scanner for over 600 stocks.