The Backtester: Test Any Symbol 22-Year Record
Goal: Pull up any stock’s full 22-year squeeze record and decide whether the name actually responds to our setups before you act on a trigger.
You need: A Squeeze Setups account, a ticker in mind, and one minute. No setup, no spreadsheet.
The Backtester is the self-serve answer to one question: “Does this symbol respond to the squeeze?” You type a ticker, pick a setup, and it runs the same per-symbol test that powers the board, daily data from 2004 to 2026. You read the stats card, the equity curve, and the trade list to see whether the name has an edge.
How do I run a backtest?
Open the Backtester, type a symbol, and toggle the setup you want to test: Slingshot Squeeze or Squeeze Signal, on the daily timeframe. That is the whole input. The tool fetches the symbol’s 22-year history, replays every trigger the setup would have fired, and renders the result.
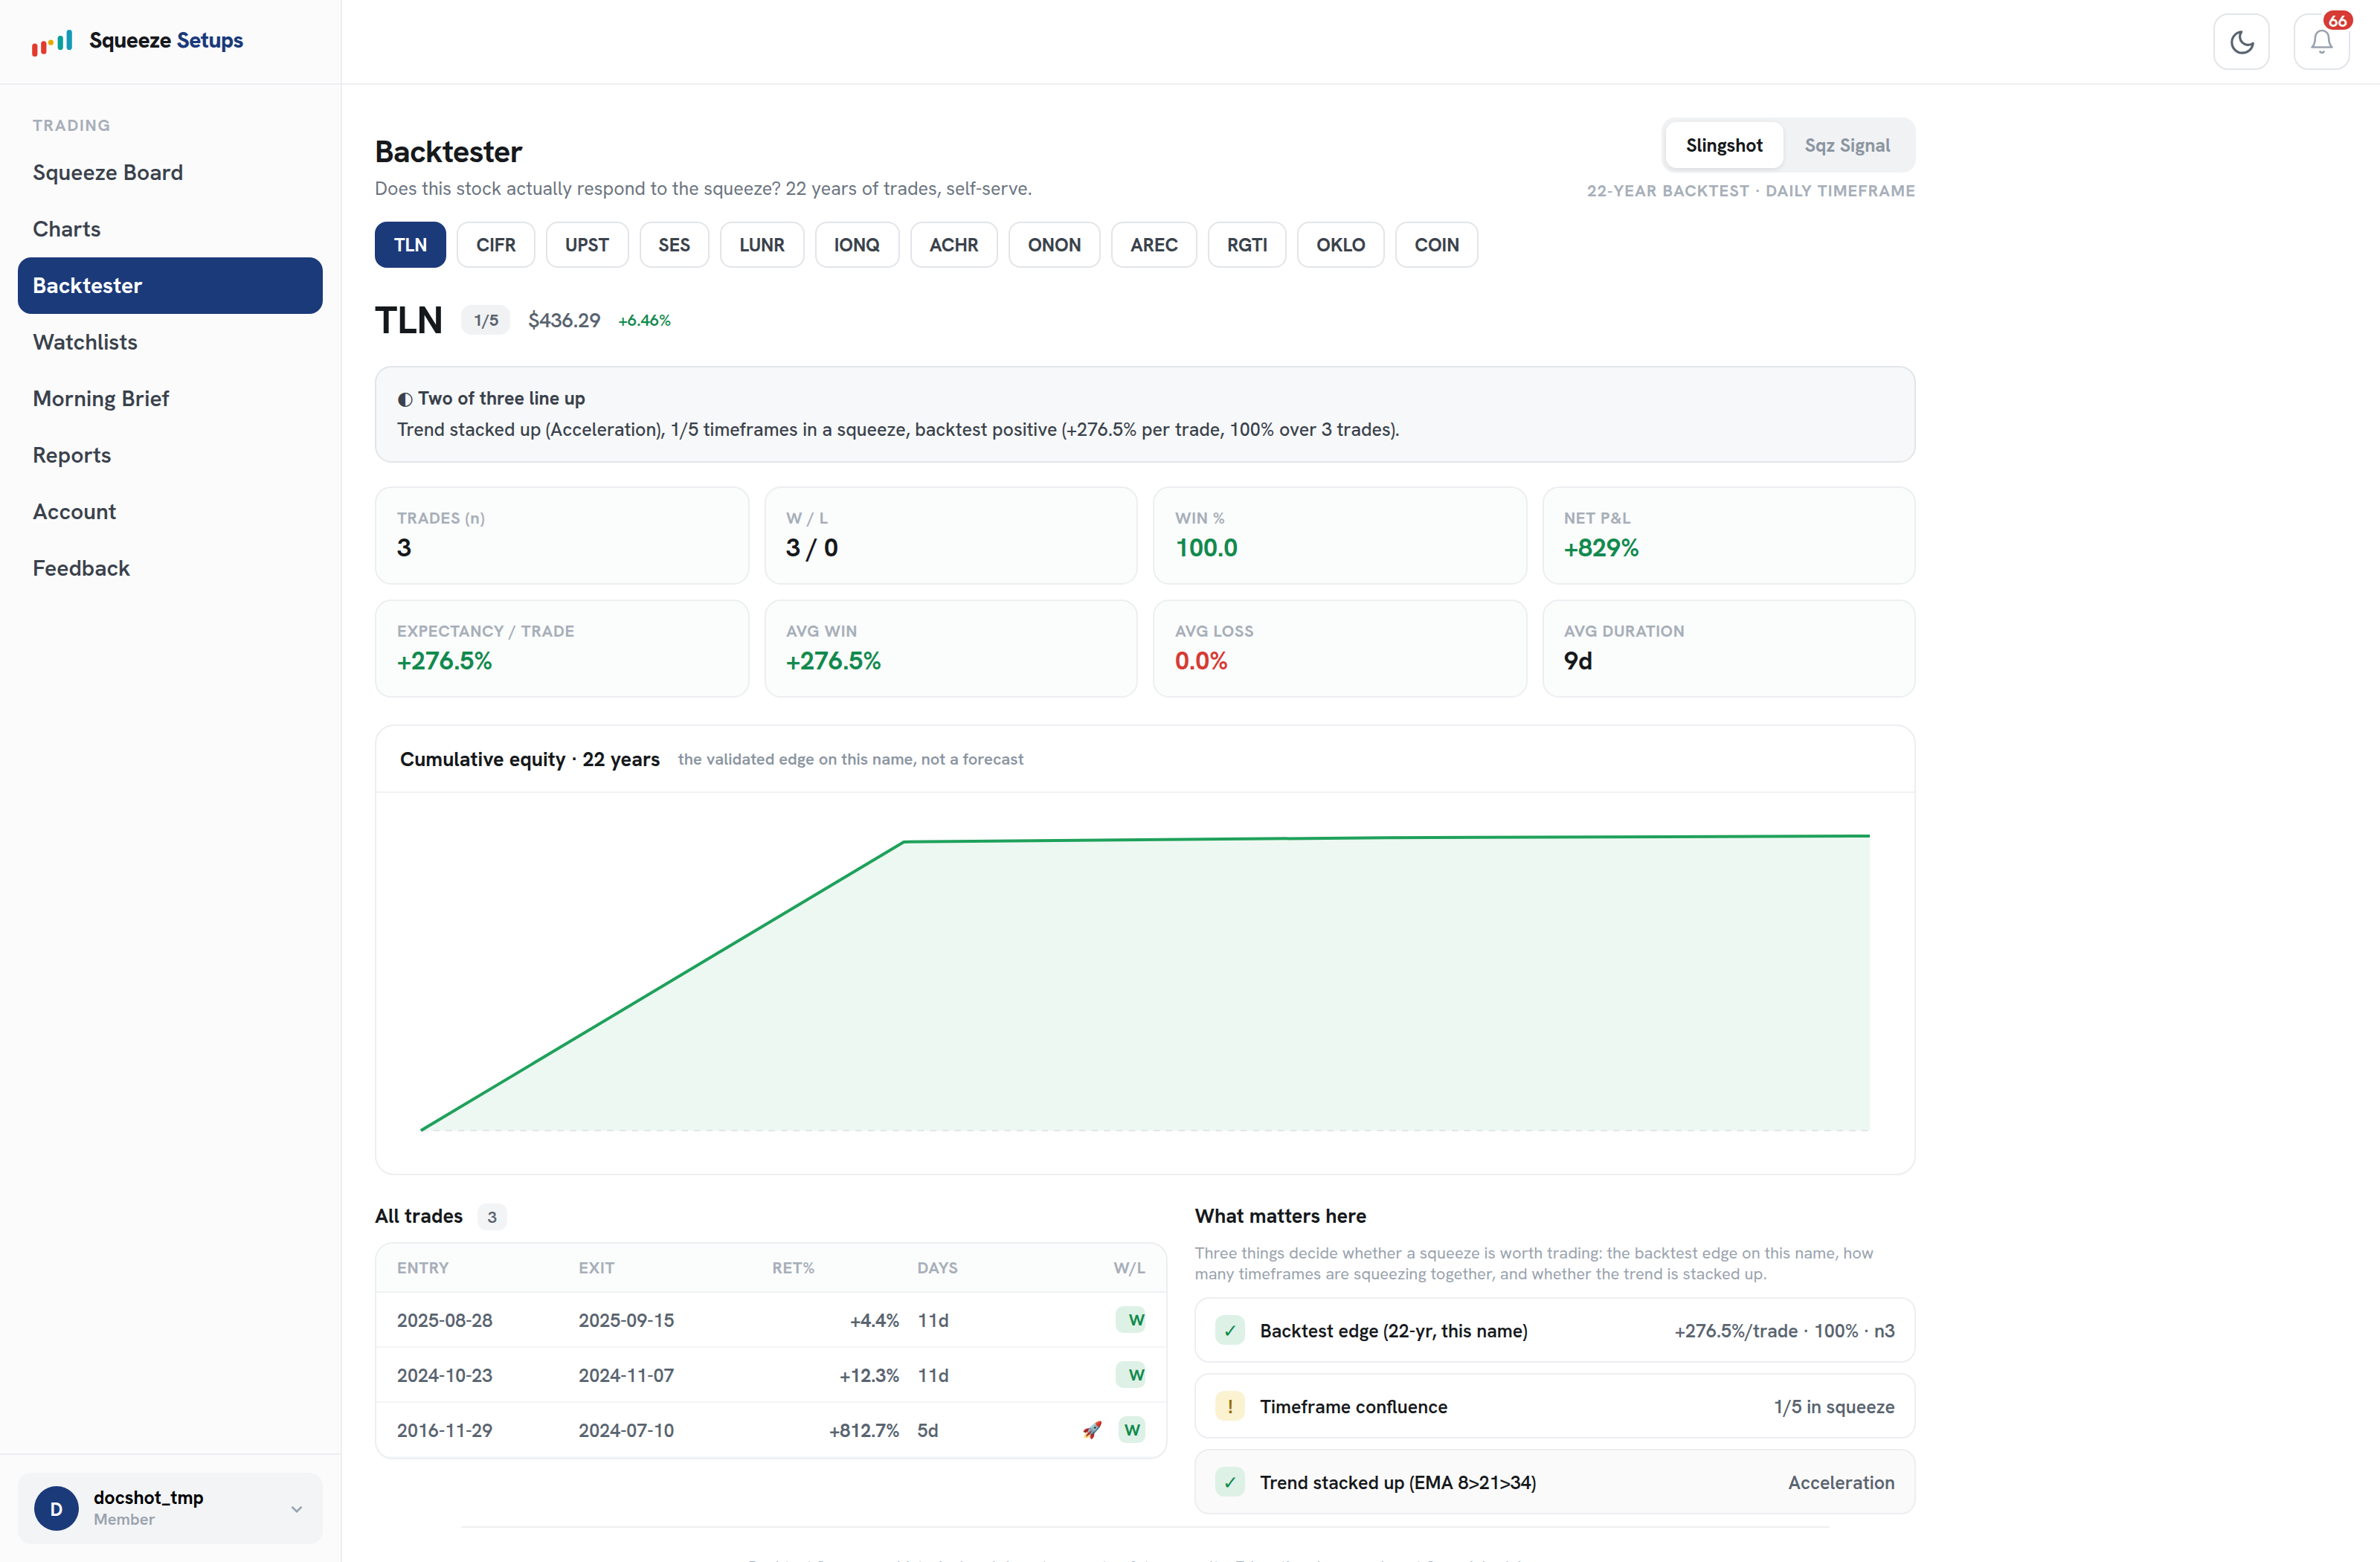
A note on scope: the daily Slingshot Squeeze and daily Squeeze Signal are the validated tests. The intraday Squeeze Signal backtest is still in progress, so the Backtester runs daily.
How do I read the stats card?
The stats card is the headline. It reports nine numbers for the symbol and setup you chose:
| Stat | What it tells you |
|---|---|
| Trades (n) | How many times this setup fired over 22 years. A bigger n is a more trustworthy record. |
| W / L | The raw count of winning and losing trades. |
| Win % | Share of trades that closed green. |
| Net P&L | Cumulative return if you took every trade at a fixed position size. |
| Expectancy / trade | Average return per trade. Positive means an edge. |
| Avg win | Average gain on winning trades. |
| Avg loss | Average give-back on losing trades. |
| Avg duration | Typical hold length in days. |
For context, here is how the setups averaged across our 614-stock universe:
- Daily Slingshot Squeeze: 69.1% win, +0.93% expectancy per trade.
- Daily Squeeze Signal: 67.4% win, +0.71% expectancy per trade.
- Bare-squeeze baseline: roughly 53.9% win, no better than a random day.
A strong individual name reads near or above those Slingshot and Squeeze Signal marks. A name where the setup barely beats a coin flip reads close to the baseline.
Why win rate is not enough: read the expectancy
A high win rate can still lose money if the losses are large. That is why we lead with expectancy. One example from our research: the short Slingshot won 60.3% of the time, yet its expectancy was about -2.0% per trade, because the losses dwarfed the wins. On the card, a green Win % paired with a red Expectancy is a warning, not a green light. Trust the expectancy column.
What does the equity curve show?
Below the card is the 22-year cumulative equity curve, the running P&L of taking every trigger in order. You are looking at the shape of the curve here, not a single number. A curve that climbs steadily across two decades is an edge that held through different markets. A curve that made all its gains in one stretch and went flat or sideways after is a name to be skeptical of, because the edge may not be stable. The board’s top setups earned their ranking on shape like this: the daily Slingshot held a 66.8% to 70.9% win rate across all five eras we tested.
What is in the trade list?
Under the curve is the full trade list, every single trigger the setup fired over 22 years, not a sample. Each row is one trade with its entry, exit, hold length, and result. This is where you sanity-check the headline. Were the wins spread across many years or clustered in one bull run? Did the setup keep firing recently, or did it go quiet a decade ago? The list lets you see what is behind the averages instead of taking them at face value.
Even our best daily setup lost roughly one trade in three. A losing streak in the list is normal, not a defect. These are historical backtests, before commissions and slippage, and never a forecast.
What is the “What matters here” panel?
Beside the results sits the “What matters here” panel, the same three pillars the board uses to rank every row:
- Backtest edge: the per-symbol 22-year record you are looking at, summarized.
- Timeframe confluence: how many timeframes are compressed at once.
- Trend: whether the EMA 8 > 21 > 34 stack is in a bullish order.
The panel turns the raw stats into a plain-language read on whether the name is currently lining up with its own history. It is the bridge from “this symbol has an edge” to “this symbol has an edge right now.”
How does this fit my workflow?
Use the Backtester to vet, not to discover. When a name catches your eye, on the board, in the Morning Brief, or from your own watchlist, drop it in here first. If the daily expectancy is positive, the curve climbs across eras, and the trade list is healthy, the name responds to the setup and is worth tracking. If the expectancy is flat or negative, you have saved yourself a trade. It is the fastest filter we have for separating stocks that squeeze well from stocks that just happen to be in a squeeze today.
Squeeze Setups is an educational research tool, not financial advice.
Related: Backtesting the squeeze: 22 years, per symbol · Which stocks squeeze well? · The Symbol Drawer