The Squeeze Edge Held in Every Era (2004 to Today)
Key takeaways:
- Across five market eras from 2004 to 2026, the daily Slingshot Squeeze won 66.8% to 70.9% of trades and the daily Squeeze Signal won 64.9% to 71.3%.
- Both stayed well above the ~53.7% random-day baseline through the 2008 and 2020 crashes and the bull runs between them.
- A real edge is one that survives regime changes. A curve fit looks great in one era and falls apart in the next.
- This is daily-only validation. The intraday Squeeze Signal backtest is still in progress.
An edge that only worked in one decade is not an edge, it is a coincidence that has not been caught yet. The honest test is whether the same rules keep working when the market changes character: through panics, through melt-ups, through years of grinding chop.
So we split our 22 years of daily data on 614 stocks into five eras and ran both setups inside each one.
The daily Slingshot Squeeze held a 66.8% to 70.9% win rate across all five. The daily Squeeze Signal held 64.9% to 71.3%. Neither slipped anywhere near the ~53.7% random-day baseline.
Why split the record into eras at all?
A single blended number can hide a lot. A setup can post a strong overall win rate while quietly earning all of it in one friendly stretch and losing money everywhere else.
Averaging papers over that. The fix is to chop the timeline into distinct market regimes and ask the same question of each one separately: did the rule still win here, when conditions were nothing like the years around it?
That is the difference between an edge and a curve fit. A curve fit is a rule tuned so tightly to the past that it describes history instead of explaining it.
It shines in the data it was built on and collapses in the data it was not. An edge works in 2009, in 2021, and in the slow years in between, because it is capturing something structural rather than something accidental.
What the five eras show
The eras span the 2008 financial crisis, the long recovery bull, the late-cycle chop, the 2020 crash and rebound, and the years since. These are genuinely different markets: different volatility, different leadership, different speed. The setups did not need any of them to be friendly.
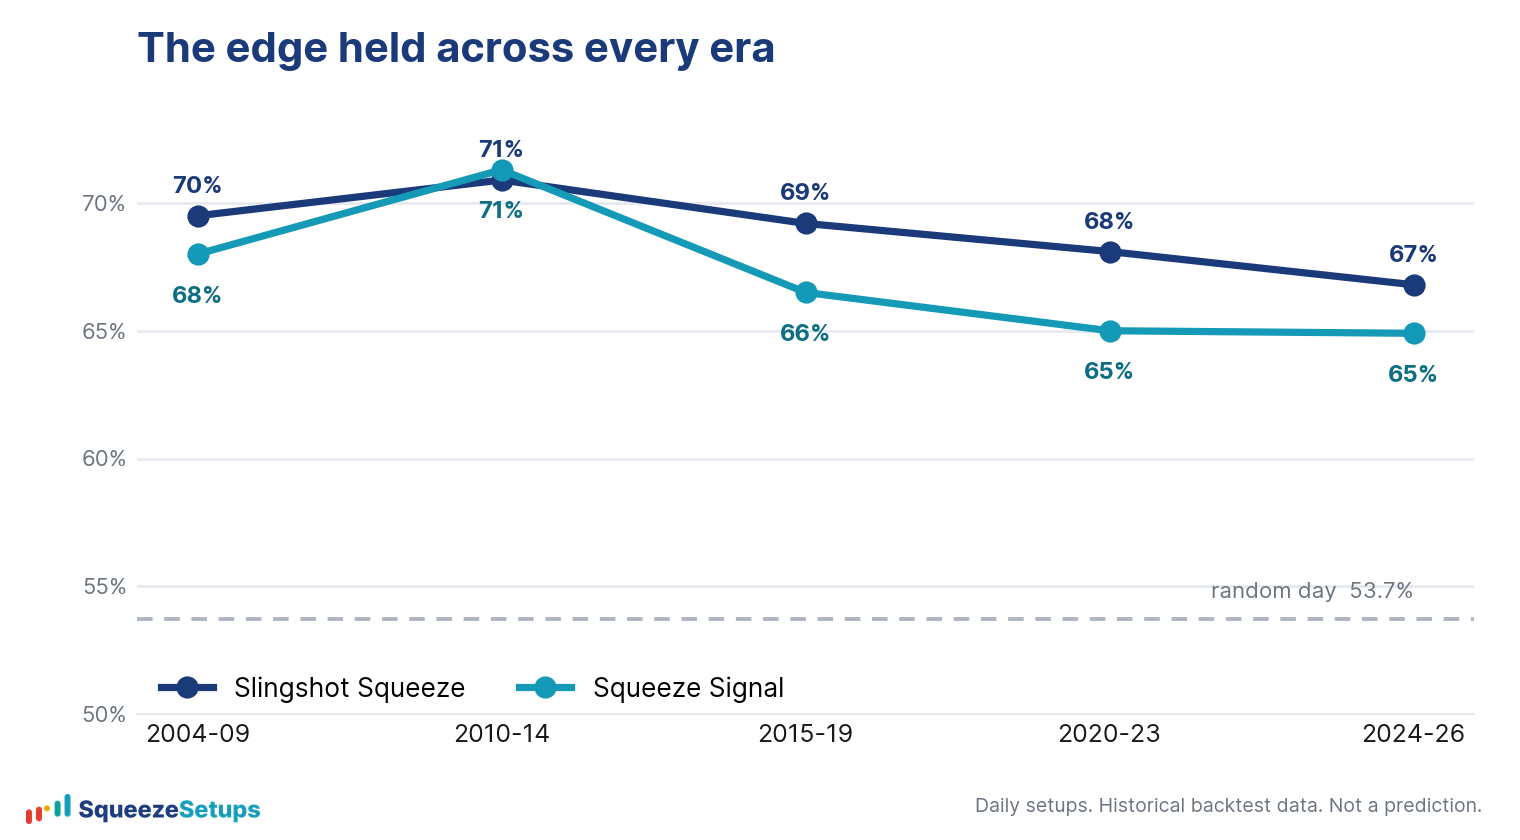
The band is tight. The Slingshot Squeeze never wandered more than about four points off its own average, and the Squeeze Signal never more than about six, while the random baseline sat far below both the whole time. There is no single era carrying the result, and no era where the rule quietly stopped working.
The era-by-era numbers
The full daily records put the era ranges in context. These are the validated daily setups, before commissions and slippage.
| Setup (daily) | Overall win % | Era range | Avg / trade | Trades |
|---|---|---|---|---|
| Slingshot Squeeze | 69.1% | 66.8% to 70.9% | +0.93% | 5,852 |
| Squeeze Signal | 67.4% | 64.9% to 71.3% | +0.71% | 4,496 |
| Random day (baseline) | ~53.7% | n/a | n/a | n/a |
The Slingshot Squeeze compounded to roughly +5,460% cumulative on a fixed position over the 22 years, with an average hold near 13 days. The Squeeze Signal, a continuation entry, compounded to about +3,188% with an average hold near 15 days.
What matters is not the size of those numbers, it is that they were earned across every regime rather than in one stretch.
What stability does not promise
Era stability tells you the edge is real and durable. It does not make it a sure thing. One trade in three still lost.
The win rate being steady at roughly 69% also means the loss rate was steady at roughly 31%, in good years and bad. A durable edge is a positive lean repeated many times, not a guarantee on any single trade.
Two more honesty notes:
- These figures are historical backtests, measured before commissions and slippage, and they are never a forecast.
- This durability study covers the daily timeframe, which is where the edge is strongest and where it is validated. The intraday Squeeze Signal backtest is still in progress, so we do not claim era stability there yet.
How to read this on the board
The same per-symbol record that produced these era numbers is what shows up in the 22-Yr Backtest columns on the Squeeze Board (n trades, Win %, Net %, Exp) and in the Backtester’s 22-year cumulative equity curve.
When you click a row, the symbol drawer scores the same three pillars we lean on: a positive per-symbol backtest, timeframe confluence, and a stacked uptrend.
The era study is the reason we trust the first of those pillars at all.
Please note: This research is based on historical backtest data. It is NOT a prediction, and it is NOT financial advice.
Related: Does the squeeze actually work?, The Slingshot Squeeze explained, The runner finding