What Is the Squeeze?
Key takeaways
- A squeeze is a volatility signal: it marks when price has compressed into an unusually tight range.
- It is measured with two bands. When the Bollinger Bands contract inside the Keltner Channels, the squeeze is on. For the full mechanism, tier by tier, see How the Squeeze Works.
- It tells you energy is stored, not which way it will release. Direction comes from momentum and trend.
- On its own a squeeze is close to a coin flip, which is why we filter it before acting.
If you have heard traders talk about a stock being “in a squeeze,” this is what they mean: a measurable kind of quiet that often comes right before a larger move. Here is how a squeeze is built, how to tell when it is still on versus when it has fired, and why the squeeze alone is not a trade.
What is a squeeze, exactly?
A squeeze is built from two sets of bands drawn around the same moving average. Most of the time the Bollinger Bands sit outside the Keltner Channels. When the market goes quiet, the Bollinger Bands shrink and slip inside the Keltner Channels. That moment, Bollinger inside Keltner, is the squeeze.
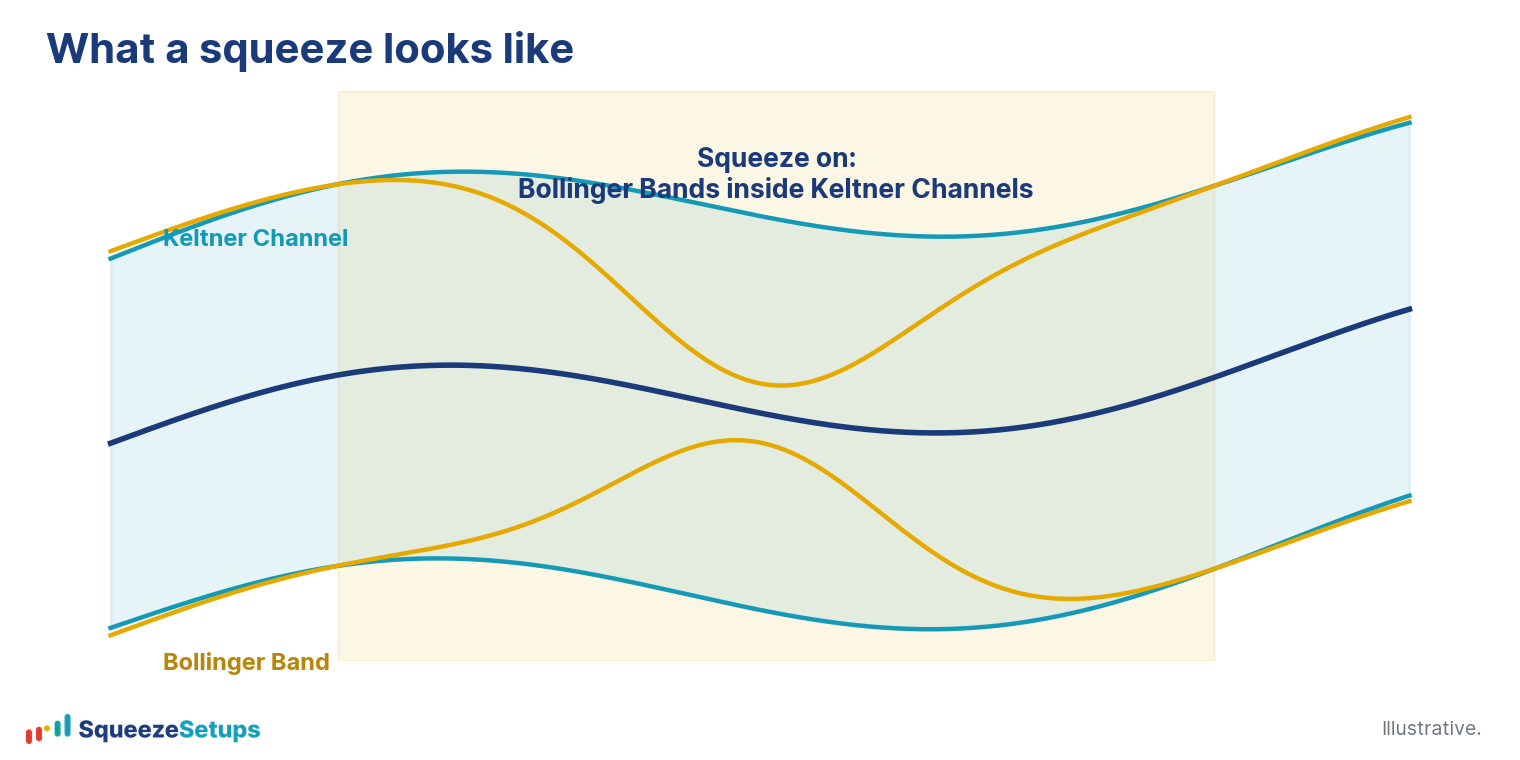
The two bands react to different things, and the squeeze is the moment they both go quiet at once:
| Band | What it tracks | What makes it widen |
|---|---|---|
| Bollinger Bands | How far closing prices spread out | Bigger, more scattered closes |
| Keltner Channels | The average size of each bar’s range | Larger high-to-low bars |
Why does a squeeze matter?
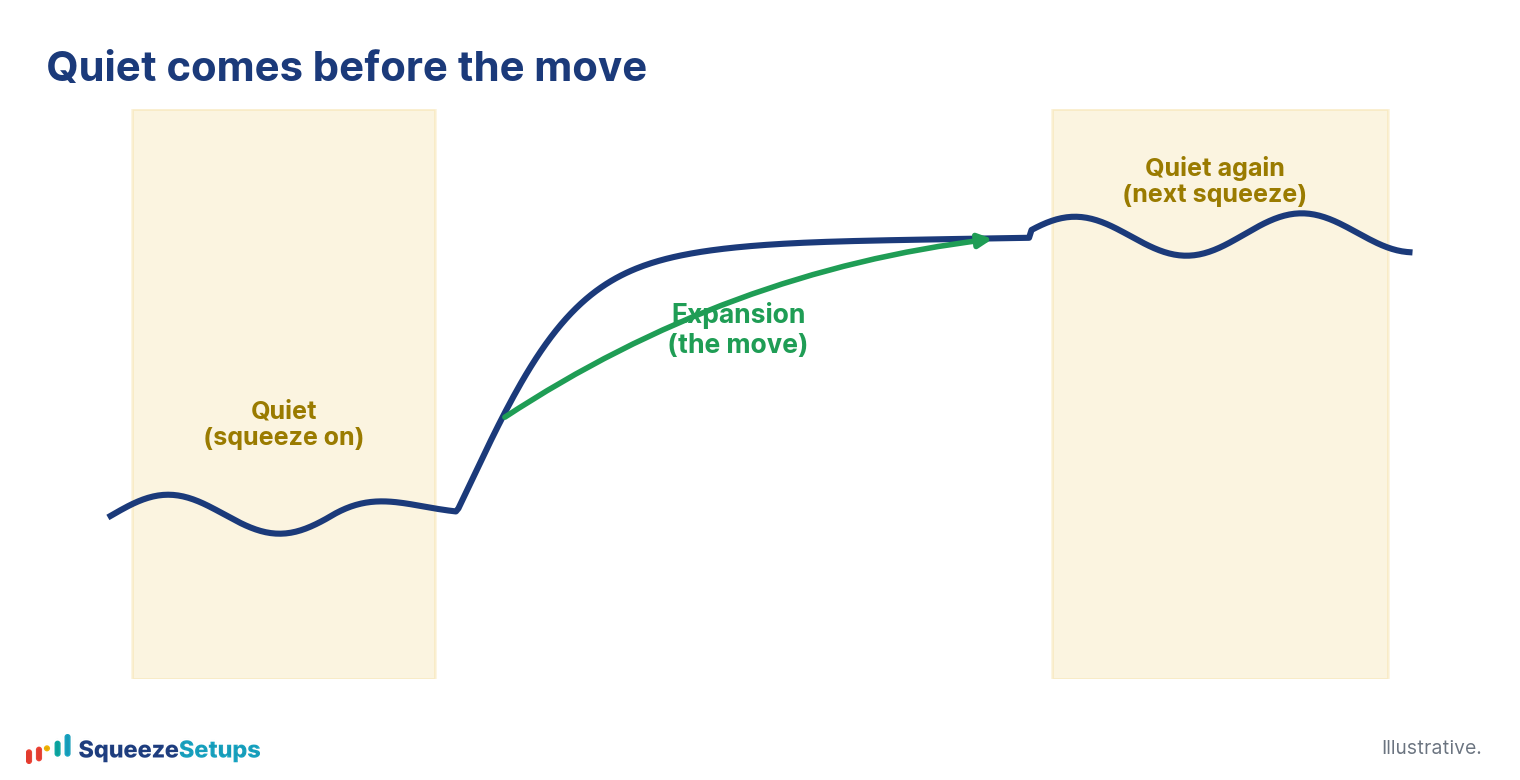
Because quiet tends to come before movement. Volatility runs in cycles: a stock drifts in a tight range, then breaks out and runs, then settles down again. The quiet stretch is the market winding up. Spotting it early is what gives you time to prepare an entry, set a stop, and size the position before the expansion happens, instead of chasing once price is already moving.
Does a squeeze tell you direction?
No. A compressed range can release up or down. This is the single most common mistake new squeeze traders make: they see a tight range and assume a breakout the way they are already leaning.
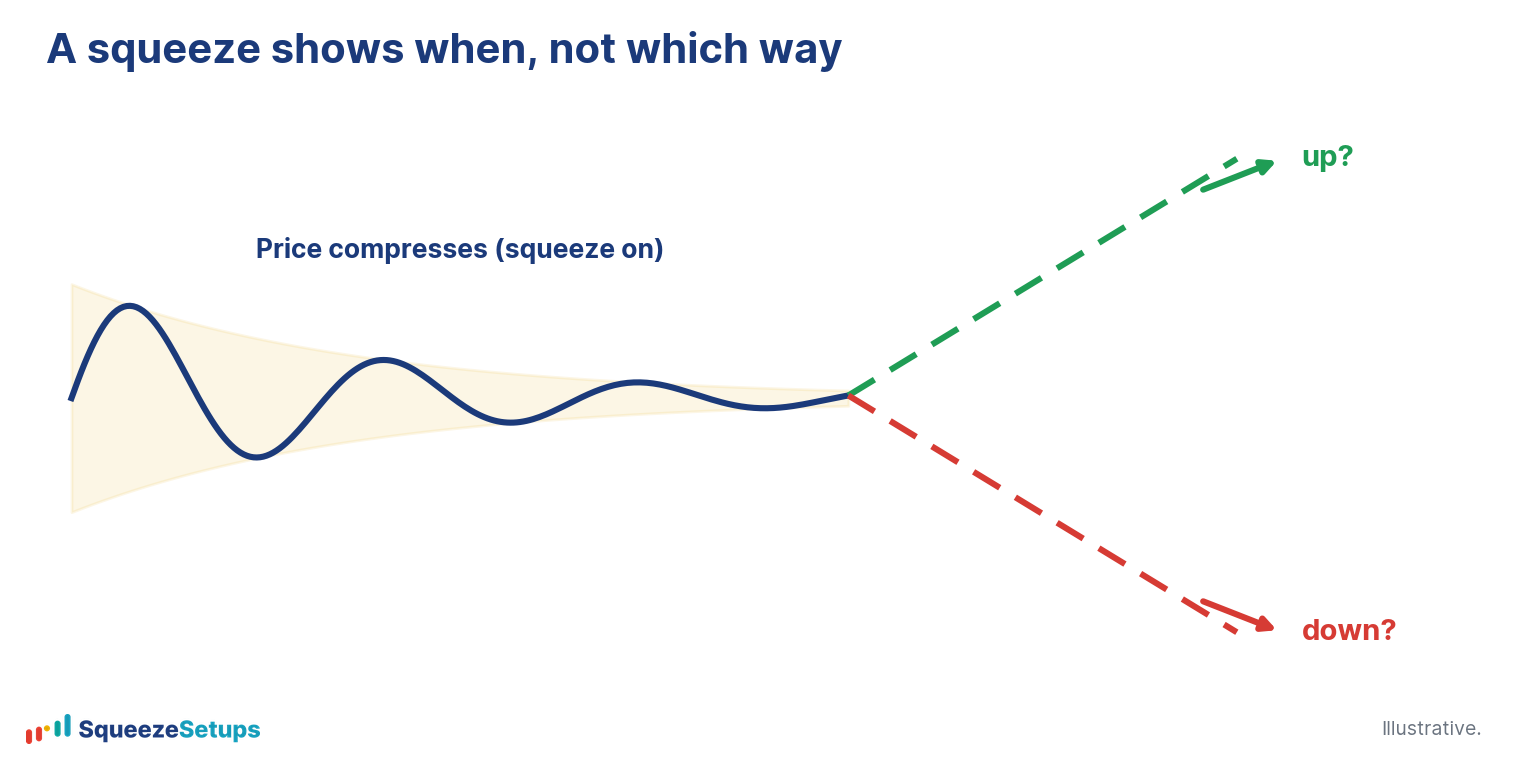
Direction is a separate read, and it comes from two things: the momentum histogram turning up or down as the squeeze holds, and the trend, the moving-average stack pointing up or down underneath price. You need both to turn a squeeze into a setup.
When is a squeeze “on” versus “fired”?
While price is still compressed, the squeeze is on, shown as colored dots. When volatility expands and the Bollinger Bands push back outside the Keltner Channels, it has fired, shown as a green dot.
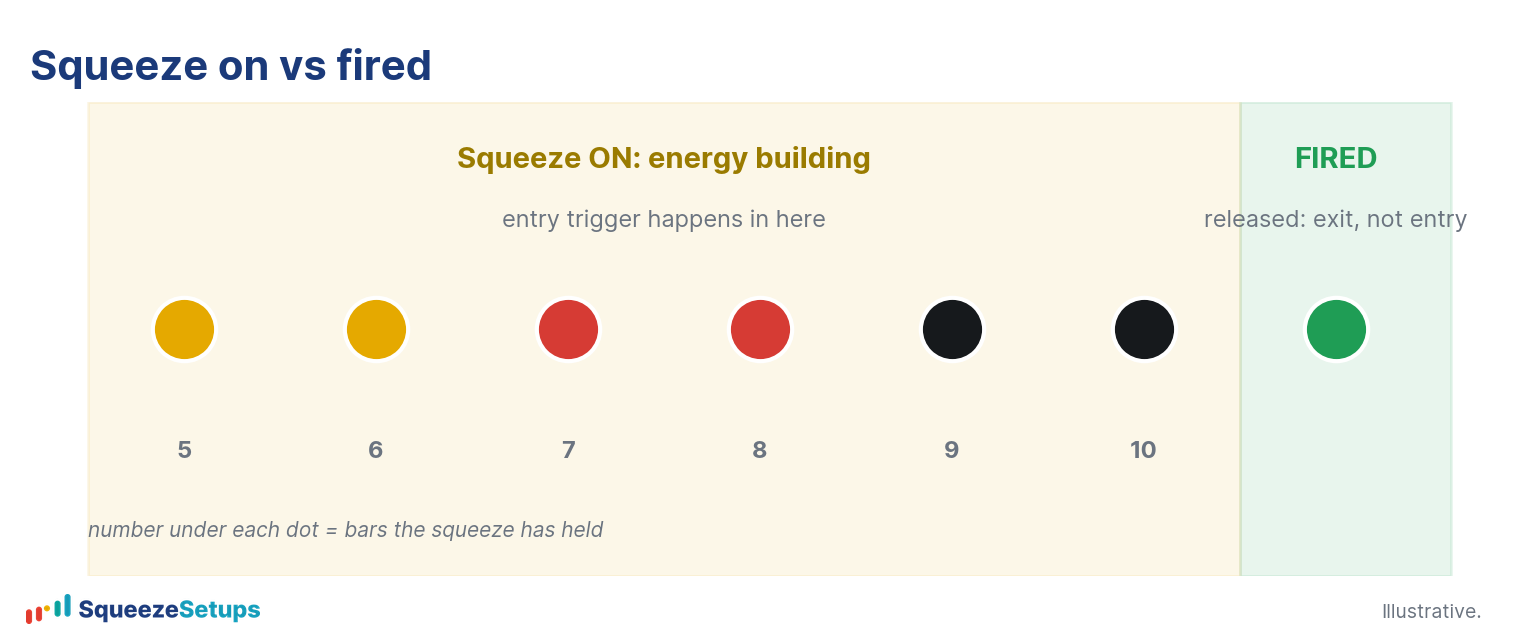
This is the part that changes how you use the signal. In our own setups the entry is the trigger that happens while the squeeze is still on. The green fire is treated as the exit, not the entry. Buying the green dot means buying after the move has already begun.
How tight is the squeeze? Reading the dots
Not every squeeze is equally tight. As compression builds, the dot changes color to show how far the bands have pulled in. On the Squeeze Board the live legend labels three building tiers plus the fired state:
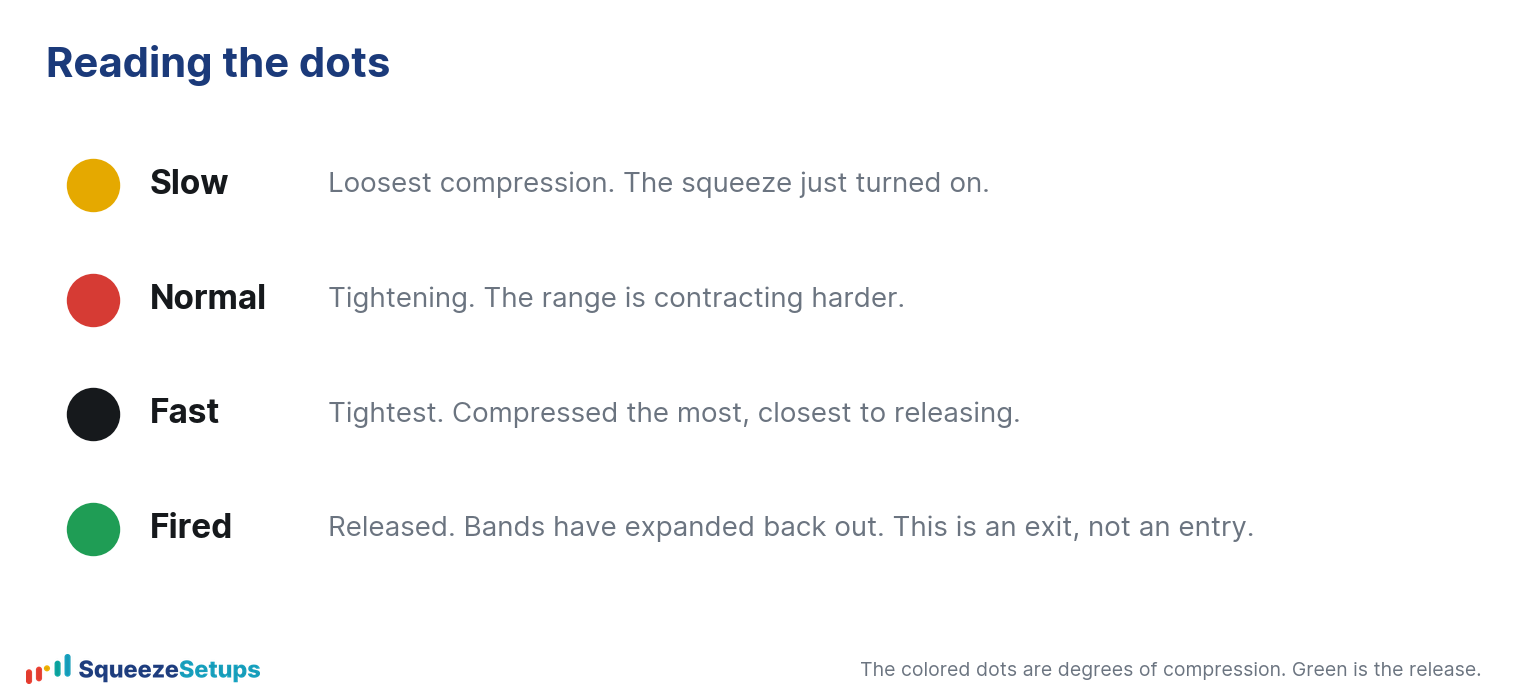
The number printed on each dot is how many bars the squeeze has held, so a tighter tier with a higher bar count is a squeeze that has been winding up for a while. Reading those dots across several timeframes at once is what reading the Squeeze Board is about.
Is a squeeze enough to trade?
No. In our 22-year backtest, buying a stock just because it was in a squeeze won about 54% of the time, no better than buying on a random day. The same is true of the popular variations: waiting for five dots, or buying the first green fire.
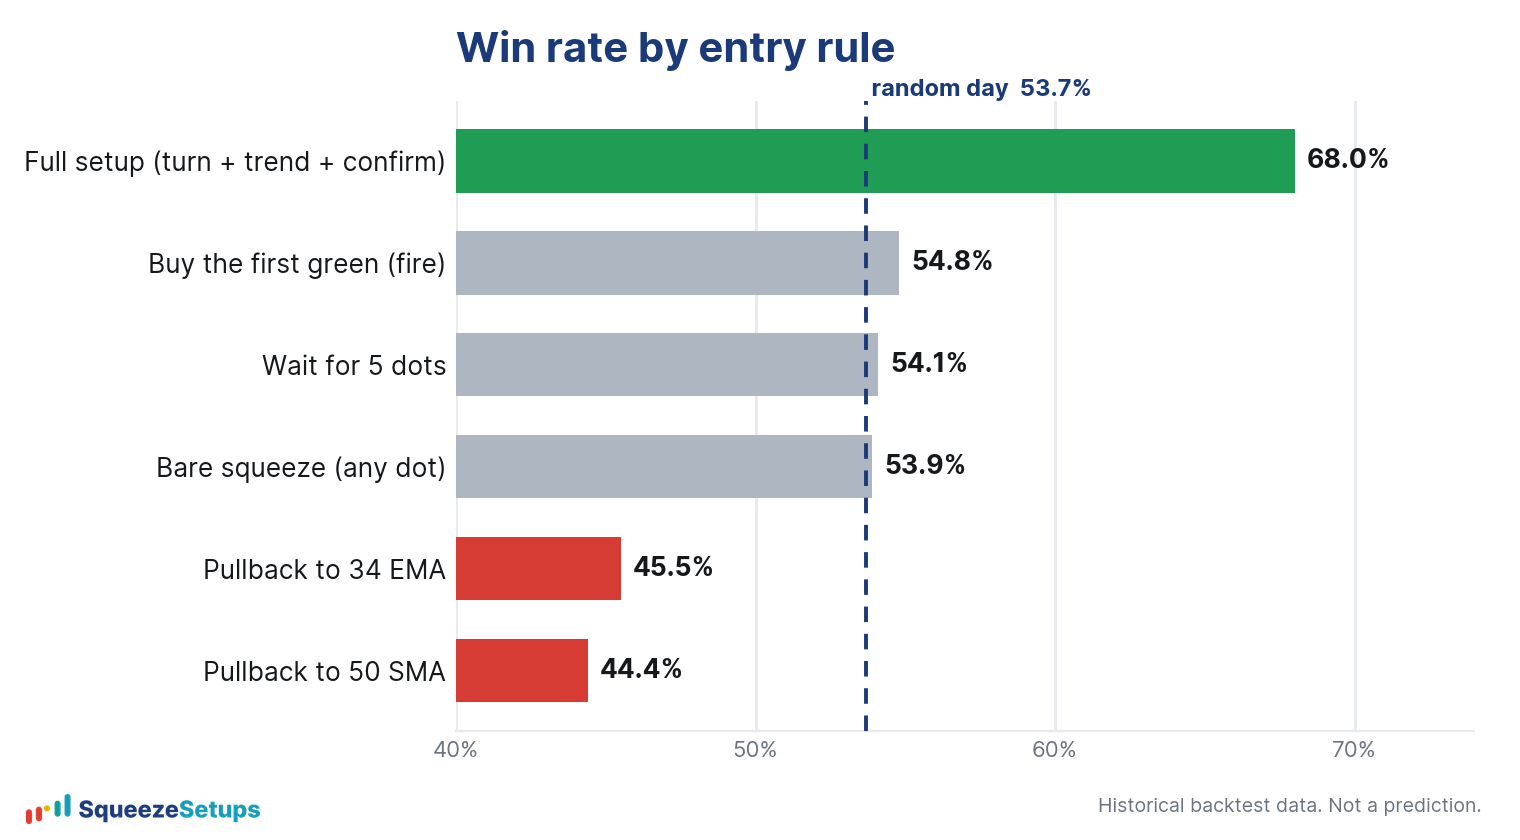
The edge comes from being selective: acting only on squeezes with momentum turning your way, a stacked trend underneath, and a backtested record on that specific name. That is the difference between a squeeze and a setup, and it is why the platform ranks squeezes instead of just listing them. For the full study behind the 54% number, see why a bare squeeze has no edge.
Please note: This research is based on historical backtest data. It is NOT a prediction, and it is NOT financial advice.
Related: Why a bare squeeze has no edge · Does the squeeze actually work? · The Slingshot Squeeze, explained.
Practice it: the Squeeze stock market game
Read real squeeze charts with the symbol hidden, call long, short or pass, and see what happened. Free, ten new charts every day. Play the Squeeze stock market game