The Dots Don’t Tell You Direction (Here Is What Does)
Key takeaways
- The squeeze dots measure one thing only: how tight the range has compressed. They say nothing about which way price will break.
- Direction is a separate read, and it comes from two layers: momentum (the histogram turning up or down) and trend (the EMA 8>21>34 stack).
- Entering on dots alone is no better than a random day: ~53.9% win versus 53.7% for any random day in our 22-year backtest of 614 stocks.
- Add direction and edge and the numbers change: the Slingshot Squeeze hits 69.1% win on daily over 5,852 trades.
A squeeze is compression, and that is all it is. When you see a tier-colored dot with a bar count on the Squeeze Board, you are looking at a measurement of how tightly the recent range has wound up, not a forecast. A compressed range can break up or down with equal ease. A common mistake is reading a stack of dark dots as “this is about to go up.” It is not. It is about to move, in either direction. Direction is a different question, answered by momentum and trend, and this article walks through both.
What do the dots actually measure?
Each dot in the SQUEEZE MATRIX represents one timeframe. The color is the tier (how tight the compression is) and the small number printed on the dot is how many bars that timeframe has been in a squeeze. A triangle marks momentum direction, but the dot itself is purely a compression gauge. Tighter compression means a bigger stored move is likely; it does not tell you the sign of that move.
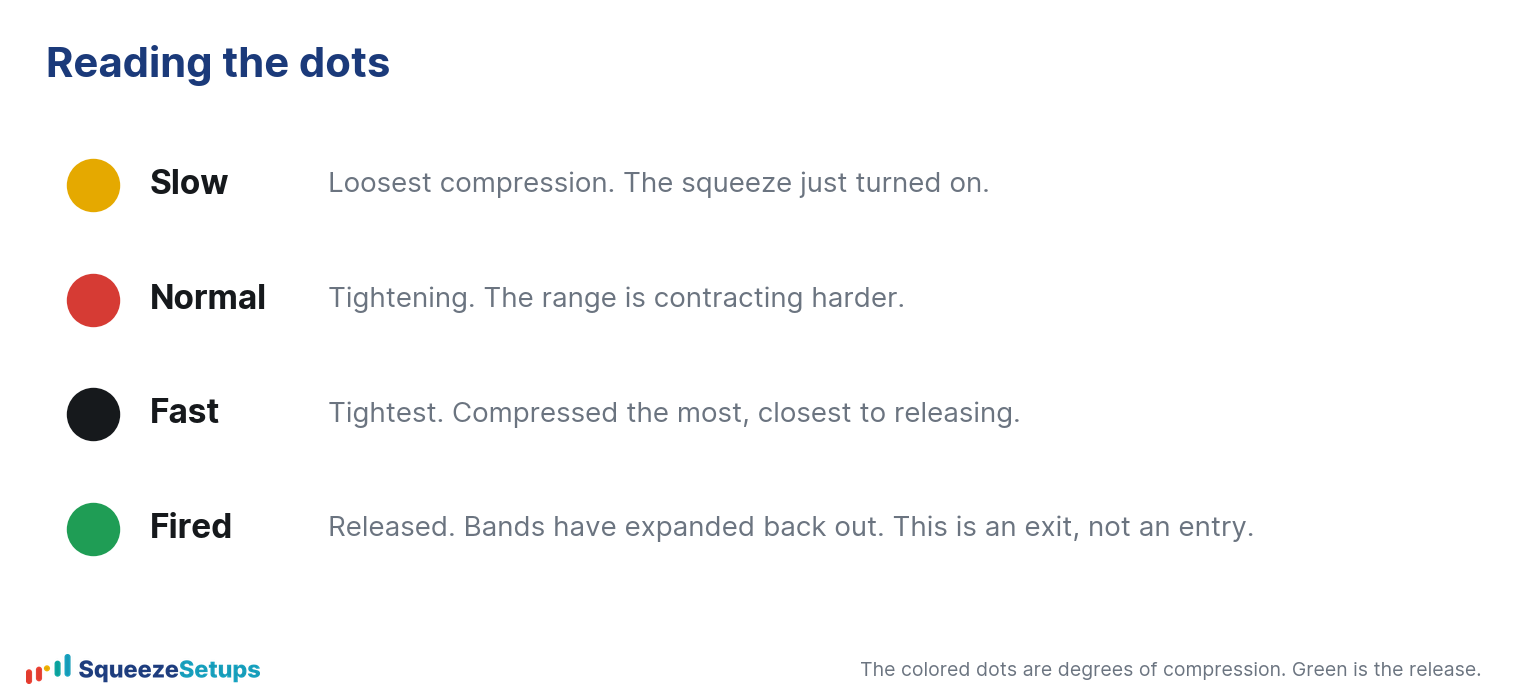
The live legend reads yellow = Tight (tightest), red = Mid, black = Loose (loosest), green = Fired. Notice that “Fired” is the only event color, and even a fired dot does not tell you direction on its own. Tighter is not bullish. Tighter is just tighter.
Why reading direction off the dots fails the backtest
If the dots predicted direction, then simply entering when a stock is in a squeeze would beat a coin flip. It does not. Across 614 stocks and 22 years of daily data, entering on a bare squeeze won ~53.9% of the time, which is statistically the same as entering on a random day (53.7%). The popular variations do not rescue it either.
| Entry rule (dots only, no direction) | Win rate |
|---|---|
| Random day (baseline) | 53.7% |
| Enter on a bare squeeze | 53.9% |
| Wait for 5 dots in a squeeze | 54.1% |
| Buy the first green (fired) dot | 54.8% |
| Pullback to the 34 EMA | 45.5% |
| Pullback to the 50 SMA | 44.4% |
Two of these are actually worse than random. The compression is real, but on its own it carries no usable directional information. You have to add the read the dots leave out.
Where does direction actually come from?
Direction is a two-part read, and neither part lives in the dots.
Momentum is the first part. The momentum histogram turning up (especially from below zero) is what tells you the stored energy is releasing to the upside. A histogram turning down says the opposite. This is the “which way” signal, and it is read separately from the compression.
Trend is the second part: the EMA stack. When the 8 is above the 21 and the 21 is above the 34 (EMA 8>21>34), the stock is in a stacked uptrend, and an upside break has the trend behind it. A break against the stack is fighting the prevailing direction. On the board, the Stack column shows how many days that bullish stack has held.
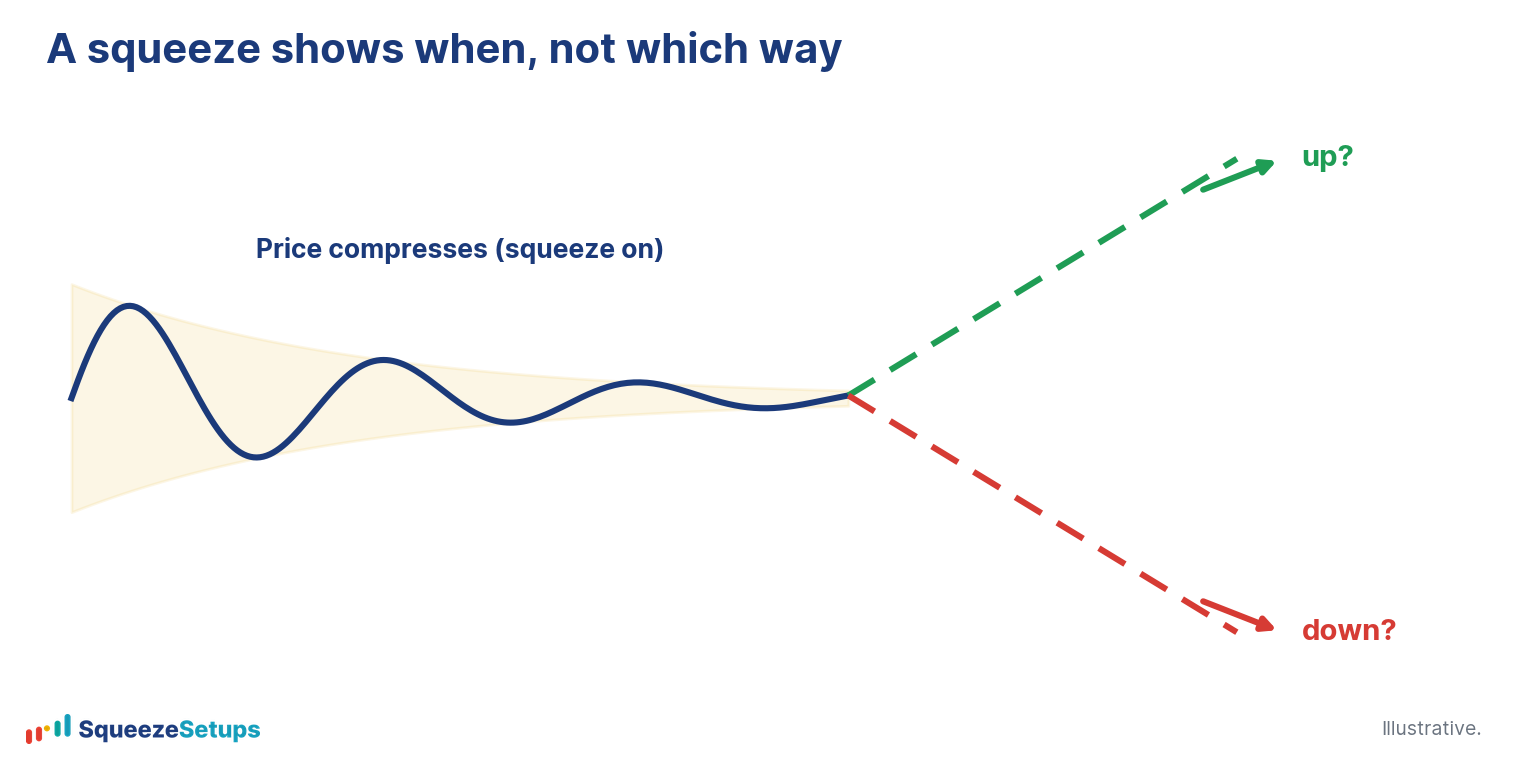
The squeeze tells you when, momentum and trend tell you which way. That separation matters. A tight squeeze in a stacked uptrend with momentum turning up is a directional read. A tight squeeze with no trend and flat momentum gives you no directional read at all.
How the setups combine the two reads
Our two named setups are built precisely on this combination, never on dots alone:
- Slingshot Squeeze: enters when momentum turns up from below zero while the squeeze is still on, in a stacked uptrend, with Edge Signal confirmation.
- Squeeze Signal: a continuation, where momentum is already above zero and the compression tightens a tier.
In both cases the entry is the trigger while the squeeze is ON, and the green fire is the EXIT, not the entry.
When you stack direction onto compression and then filter by a positive per-symbol backtest, the edge appears. On daily data the Slingshot Squeeze wins 69.1% over 5,852 trades at +0.93% average per trade, and the Squeeze Signal wins 67.4% over 4,496 trades at +0.71%. Both are era-stable across the full 22 years. That gap, from ~54% on dots alone to ~69% with direction and edge, is the part the dots cannot give you by themselves.
One honest caveat: even the strong setups still lose. One trade in three on the Slingshot still went against us. Direction improves the odds; it does not remove risk. And all of these figures are historical backtests before commissions and slippage.
Reading the board the right way
On the Squeeze Board, do not stop at the SQUEEZE MATRIX. Read across the row:
- Trigger: a gold arrow for a Slingshot Squeeze or a cyan arrow for a Squeeze Signal, your directional signal with a timeframe attached.
- Stack: tells you whether the trend supports an upside break.
- MP (Market Pulse): reads Acceleration, Accumulation, Distribution, or Deceleration.
- 22-Yr Backtest: gives the per-symbol win %, net %, and expectancy.
The dots tell you a move is loaded; the rest of the row tells you whether to take it and which way.
Please note: This research is based on historical backtest data. It is NOT a prediction, and it is NOT financial advice.
Related: What is the squeeze?, Momentum colors and the turn, The Slingshot Squeeze explained