Multi-Timeframe Squeeze Confluence
Key takeaways:
- Confluence is when several timeframes are in a squeeze at the same time. The board shows it as the TFs count, for example 5/5.
- Confluence is one of our three pillars (alongside backtest edge and trend), and the board ranks rows by all three together.
- More timeframes compressing at once means the move is being squeezed across multiple horizons, not just one chart, so a trigger has more behind it.
- Confluence is context, not a standalone signal. The trade is still the trigger plus a positive 22-year record on that specific symbol.
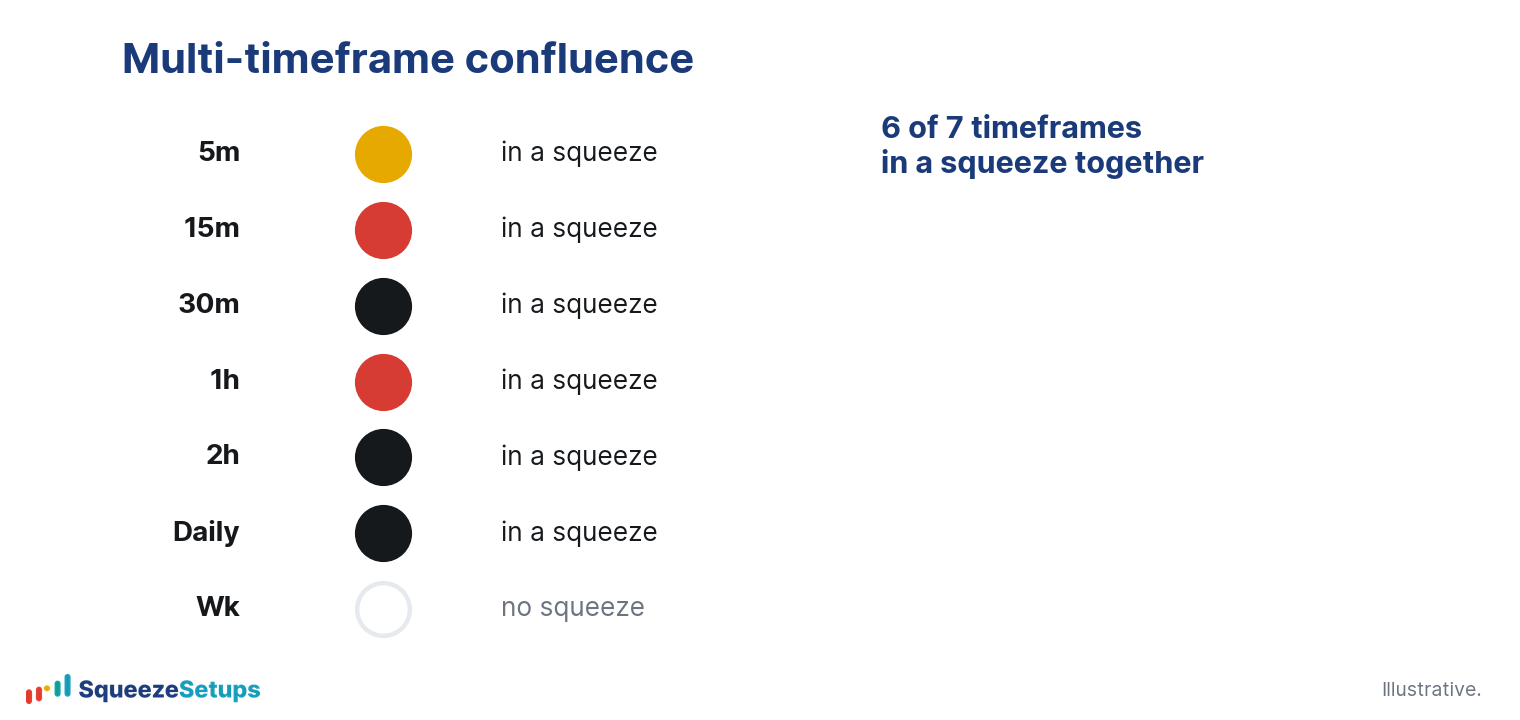
When you stack several timeframes and they are all in a squeeze at once, that is confluence. On the Squeeze Board we count it for you in the TFs column: a row reading 5/5 means every shown timeframe is compressed; 2/5 means only two are. The more timeframes lined up, the more we treat that row as a setup worth your attention, because the compression is showing up across horizons rather than on a single chart.
What is timeframe confluence?
A squeeze on the daily chart tells you the daily range has tightened. A squeeze on the 30-minute chart tells you the same thing on a much shorter horizon. When both are squeezing at once, two different groups of traders, swing and intraday, are watching the same compression. When five timeframes are squeezing at once, the agreement is harder to dismiss as noise on one chart.
This is the second of our three pillars. The first is backtest edge, the per-symbol 22-year record. The third is trend, the EMA 8 greater than 21 greater than 34 stack. Confluence sits in the middle: it does not tell you which way price will go, and it does not replace the edge check, but it tells you the compression is broad. A trigger that fires while five timeframes are tightened has more behind it than the same trigger firing while one is.
How the board surfaces confluence
You do not have to flip between charts to find confluence. Each row on the Squeeze Board carries a SQUEEZE MATRIX, one dot per timeframe, where each dot tells you three things:
- Color is the tier: yellow Tight and tightest, red Mid, black Loose and loosest, green Fired.
- Number on the dot is how many bars that timeframe has been in the squeeze.
- Triangle shows momentum direction.
Next to the matrix, the TFs column collapses all of that into a single count, such as 5/5, so you can scan dozens of names quickly.

To work confluence directly, use the board controls:
- Multi-TF Squeeze tab filters to rows where multiple timeframes are compressed.
- Timeframes picker lets you choose which columns show, so you can decide which horizons count as confluence for your style.
- Tier filter narrows to a dot color, and Clear all resets everything.
If you want to see how a single row earns its rank, click it to open the symbol drawer, which scores all three pillars in plain language, including the timeframe confluence.
Why stacked timeframes are a stronger setup
Confluence is a quality filter, not a separate edge we can give you a win rate for. The validated edge lives in the two named setups on the daily timeframe:
- Slingshot Squeeze: 69.1% across 5,852 trades at +0.93% per trade, era-stable from 66.8% to 70.9% over five eras.
- Squeeze Signal: 67.4% across 4,496 daily trades at +0.71% per trade.
Confluence is the context we want around those triggers, because a trigger backed by broad compression and a positive per-symbol record is a cleaner version of the same trade.
It also helps you avoid the weak version. A bare squeeze entry on one timeframe wins about 53.9%, no better than a random day at 53.7%. Waiting for the squeeze to tighten or buying the first green dot nudges that to roughly 54% to 55%. Compression alone is not the edge. Confluence raises the bar on which compressions you bother to watch, so you spend your attention on the rows where multiple horizons agree rather than on a single chart that happens to be quiet.
Expectancy is also not equal across timeframes, which is why the count matters more than any single dot. Per trade, the daily Slingshot Squeeze returns +0.93%, far ahead of the shorter horizons:
| Timeframe | Slingshot expectancy / trade |
|---|---|
| Daily | +0.93% |
| 4h / 240m | +0.56% |
| 30m | +0.51% |
| 195m | +0.44% |
| 130m | +0.41% |
| 78m | +0.18% |
| 2h / 120m | +0.15% |
| 1h / 60m | +0.10% |
| 39m | +0.06% |
| 5m | +0.01% |
| 15m | about -0.04% |
So a 5/5 row anchored by a daily squeeze is doing more work than a 5/5 row built only from the shortest timeframes. Read the count alongside which timeframes make it up, and lean on the daily, where the edge is strongest and validated.
How to use confluence in practice
Treat confluence as a way to shorten your list, then verify each name on its own merits. Scan for high TFs counts, then open the symbol drawer or the Backtester to confirm the per-symbol 22-year record is positive before you act on a trigger. Remember the rule that holds for both setups: you enter on the trigger while the squeeze is still on, and the green fire is the exit, not the entry. Confluence tells you the compression is broad; it does not change when you get in or out.
Keep the limits in view. Confluence is not a forecast, and even our strongest validated setup loses one trade in three. The intraday Squeeze Signal backtest is still in progress, so for now the validated edge is daily only. Use the count to focus, use the per-symbol record to decide.
Please note: This research is based on historical backtest data. It is NOT a prediction, and it is NOT financial advice.
Related: How to read the Squeeze Board, What is the squeeze?, How the platform ranks and qualifies setups