The Best Squeeze Settings (and Why Defaults Are Right)
Key takeaways:
- The standard squeeze compares Bollinger Bands (20, 2) against Keltner Channels (20, around 1.5x range). A squeeze is on when the bands sit inside the channels.
- Those defaults are well chosen. Loosening or tightening them mostly trades fewer signals for more signals, not better ones.
- Our entire 22-year backtest across 614 stocks runs on the standard settings. We did not tune the squeeze definition to chase results.
- The edge comes from what you require around the squeeze (trend, timeframe confluence, a per-symbol backtest record), not from a custom band setting.
If you are looking for the “best” squeeze settings, the honest answer is the default ones: Bollinger Bands at length 20 and 2 standard deviations, plotted against Keltner Channels at length 20 and roughly 1.5 times the average range. The squeeze is simply the period when the Bollinger Bands contract inside the Keltner Channels. We use these settings unchanged, and below we explain why tinkering rarely helps.
What are the standard squeeze settings?
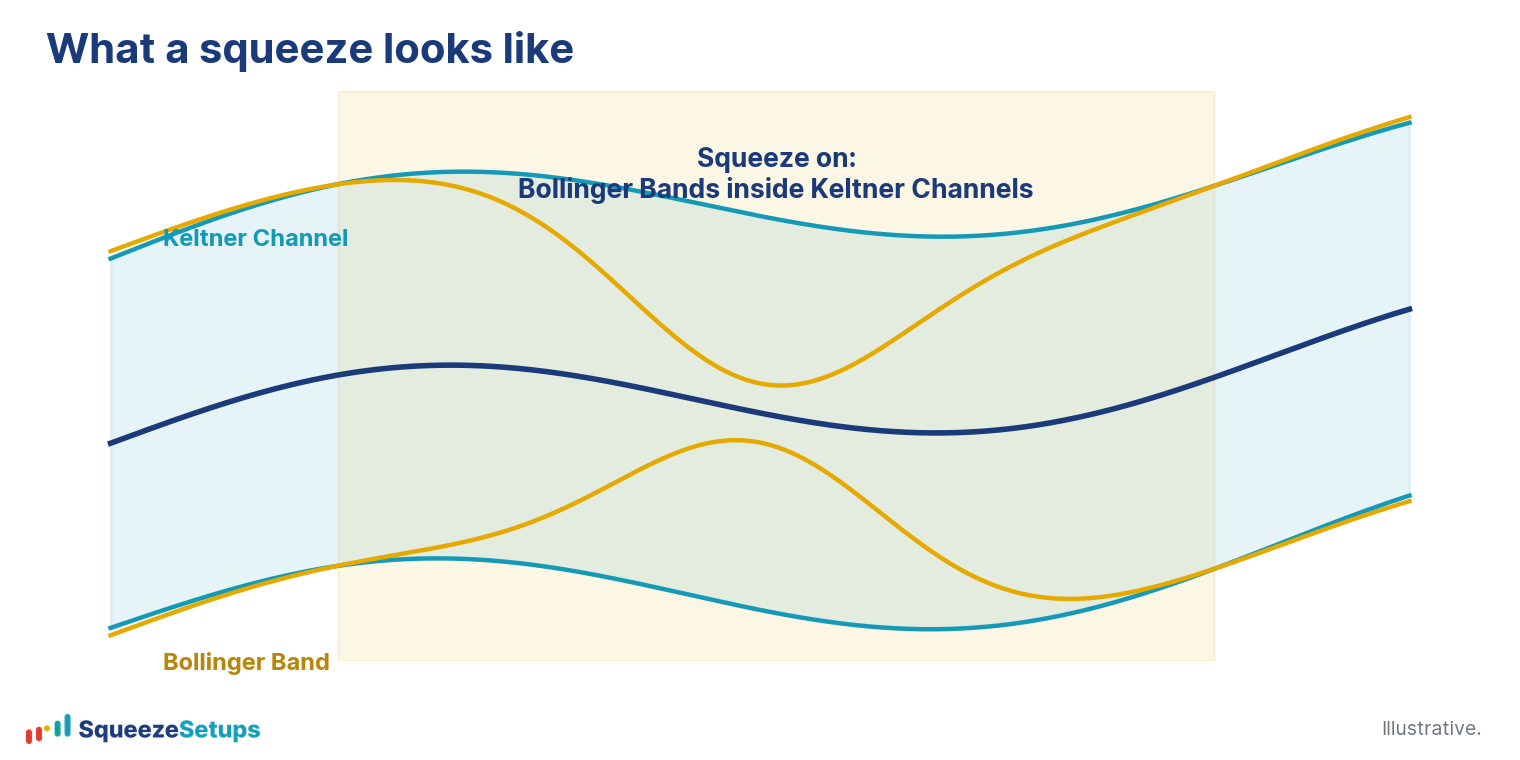
Two volatility envelopes do the work. Bollinger Bands measure how far price has wandered from its 20-period average using standard deviation, so they widen fast when price moves and pull in when price goes quiet. Keltner Channels measure the same average distance using the typical bar range instead. When volatility drops far enough that the Bollinger Bands fall inside the Keltner Channels, price has tightened into a narrow range. That is the squeeze. When the bands push back outside the channels, the squeeze releases.
| Component | Standard setting | What it tracks |
|---|---|---|
| Bollinger Bands | length 20, 2 standard deviations | Volatility (how far price strays from its mean) |
| Keltner Channels | length 20, around 1.5x range | Typical bar range around the same mean |
| Squeeze condition | Bands inside the channels | Price compressed into a tight range |
Why are the defaults well chosen?
The defaults are balanced. Both envelopes share the same 20-period lookback, so you are comparing two readings of the same window rather than two unrelated horizons. The 2 standard deviation Bollinger setting captures roughly the bulk of normal price variation, and the 1.5x Keltner range is wide enough that the bands only fall inside it when price genuinely goes quiet. Together they fire a squeeze when there is real compression and stay silent when there is not.
Change one number and you mostly shift the count, not the quality:
- Tighten the Keltner multiplier (say to 1.0x) and squeezes become rare and brief, so you see fewer setups and react later.
- Loosen it (to 2.0x or 3.0x) and almost everything looks like a squeeze, so the signal stops meaning anything.
- Shorten the lookback and the squeeze flips on and off with noise.
- Lengthen it and it lags badly.
The defaults sit in the sensible middle of all of these tradeoffs, which is why they have become the standard across charting platforms.
Does tuning the settings improve the edge?
This is the question to answer with data, and the result is clear: the squeeze definition is not where the edge comes from. A bare squeeze entry on the standard settings won about 53.9% of the time in our backtest, which is no better than buying on a random day (53.7%). Common tweaks did not rescue it:
- Wait for five dots before entry: around 54.1%.
- Buy the first green (fired) dot: about 54.8%.
- Pullback to the 34 EMA: worse at 45.5%.
- Pullback to the 50 SMA: worse still at 44.4%.
Changing how and when you read the same squeeze does not produce an edge. If retuning the band or channel parameters reliably produced a better number, you would expect at least one of these variations to break away from random. None did. That is also why we did not adjust the squeeze settings to make the backtest look good: a definition tuned to one history tends to fall apart on the next.
Where the edge actually comes from
What moves win rates is not a custom band setting, it is what you require around the squeeze. When we add our three requirements, the same standard squeeze starts to show an edge:
- Backtest edge: the per-symbol 22-year record, so you only act on names that have historically paid.
- Timeframe confluence: several shown timeframes compressed at once, not just one.
- Trend: a stacked uptrend with the EMA 8 above 21 above 34.
Built on those, our daily Slingshot Squeeze won 69.1% of 5,852 trades at +0.93% average per trade, and the daily Squeeze Signal won 67.4% of 4,496 trades at +0.71%. Both used the standard squeeze settings throughout. The squeeze tells you price is compressed; the pillars and the Edge Signal confirmation tell you whether that compression is worth trading. That division of labor is exactly why we leave the settings alone.
So what should you set?
Leave the squeeze on its defaults: Bollinger Bands (20, 2) inside Keltner Channels (20, around 1.5x). On the Squeeze Board, every dot already uses these settings, with the color showing the tier (yellow Tight, red Mid, black Loose, green Fired) and the number showing how many bars the squeeze has run. Spend your effort on what the board ranks by, namely trend, confluence, and the 22-year record, rather than on hunting for a magic band multiplier. One trade in three still lost even at our best win rates, so no setting makes the squeeze a sure thing.
Please note: This research is based on historical backtest data. It is NOT a prediction, and it is NOT financial advice.
Related: What is the squeeze?, Squeeze dot colors explained, Do our squeeze dots match thinkorswim?