Squeeze vs LazyBear Squeeze Momentum
Key takeaways:
- The squeeze and the LazyBear Squeeze Momentum variant share the same core idea: pair a volatility compression with a momentum histogram that tells you which way price is leaning.
- They differ mostly in how they are computed, not in concept. The compression test and the momentum readout are computed a little differently, but both answer the same two questions.
- Our edge does not come from the indicator flavor. It comes from filtering (trend stack, timeframe confluence) and a per-symbol 22-year backtest.
- A bare squeeze, in any flavor, wins about 53.9%, no better than a random day. The filtering is what moves the number.
If you have used LazyBear’s Squeeze Momentum indicator on TradingView, our squeeze will feel familiar. Both tools watch for a market that has tightened into a low-volatility range, and both layer a momentum histogram on top so you can see whether the building pressure is leaning up or down. Conceptually they are the same; mechanically they differ a little; and neither difference is what matters for results. What matters is what you do after the indicator signals.
What do both indicators actually measure?
Every squeeze-style indicator is really two measurements stacked together. The first is a compression test: it asks whether the market’s recent range has contracted below its normal level. When it has, the market is “in a squeeze,” meaning price is wound tight and a larger move tends to follow at some point. The second is a momentum readout, usually drawn as a histogram of bars that rise and fall and change color as momentum turns. The histogram is what tells you not just that a move may be coming but which way it is currently leaning.
LazyBear’s Squeeze Momentum and our squeeze both do exactly this. They both flag the compression and they both show a momentum histogram whose color flips as the turn happens. If you put them side by side on a chart, you will see the same general rhythm: a quiet, tightened stretch, then a momentum histogram that crosses and changes color as the move begins.
Where do they differ?
The differences are in how each is computed, not in the result. The compression test can be built from different volatility bands, and the momentum histogram can be computed from a different lookback or smoothing. Those choices change the exact bar on which the indicator switches color, and they change how sensitive it is to small moves. One flavor may flip a bar earlier or later than another. That is real, but it is a difference of timing and sensitivity, not of idea.
In practice, do not treat one variant as if it holds something the others lack. A squeeze histogram that turns green a bar sooner is a tuning choice, not an edge. We have tested the bare version of this signal directly, and the numbers say the flavor is not what wins.
| Question | How both answer it |
|---|---|
| Is the market compressed? | A volatility band test flags when the recent range has tightened. |
| Which way is momentum leaning? | A momentum histogram rises, falls, and changes color as the turn happens. |
| When does the move start? | The histogram crossing and color flip mark the turn; exact bar depends on tuning. |
Why the indicator flavor is not the edge
We ran a 22-year backtest across 614 stocks on daily data from 2004 to 2026 to measure what a bare squeeze entry is worth. None of these unfiltered rules beats a coin flip:
- Bare squeeze entry: wins about 53.9%, essentially the same as buying on a random day (53.7%).
- Wait for the squeeze to tighten further (the “wait for five dots” idea): about 54.1%.
- Buy the first green momentum dot: about 54.8%.
- Pullback to the 34 EMA: about 45.5%, worse than random.
- Pullback to the 50 SMA: about 44.4%, also worse than random.
None of those numbers depends on whether you used LazyBear’s tuning or ours. The compression-plus-momentum concept, on its own, is close to a coin flip. So swapping one squeeze flavor for another to chase a slightly earlier signal is optimizing the wrong variable.
What does move the number?
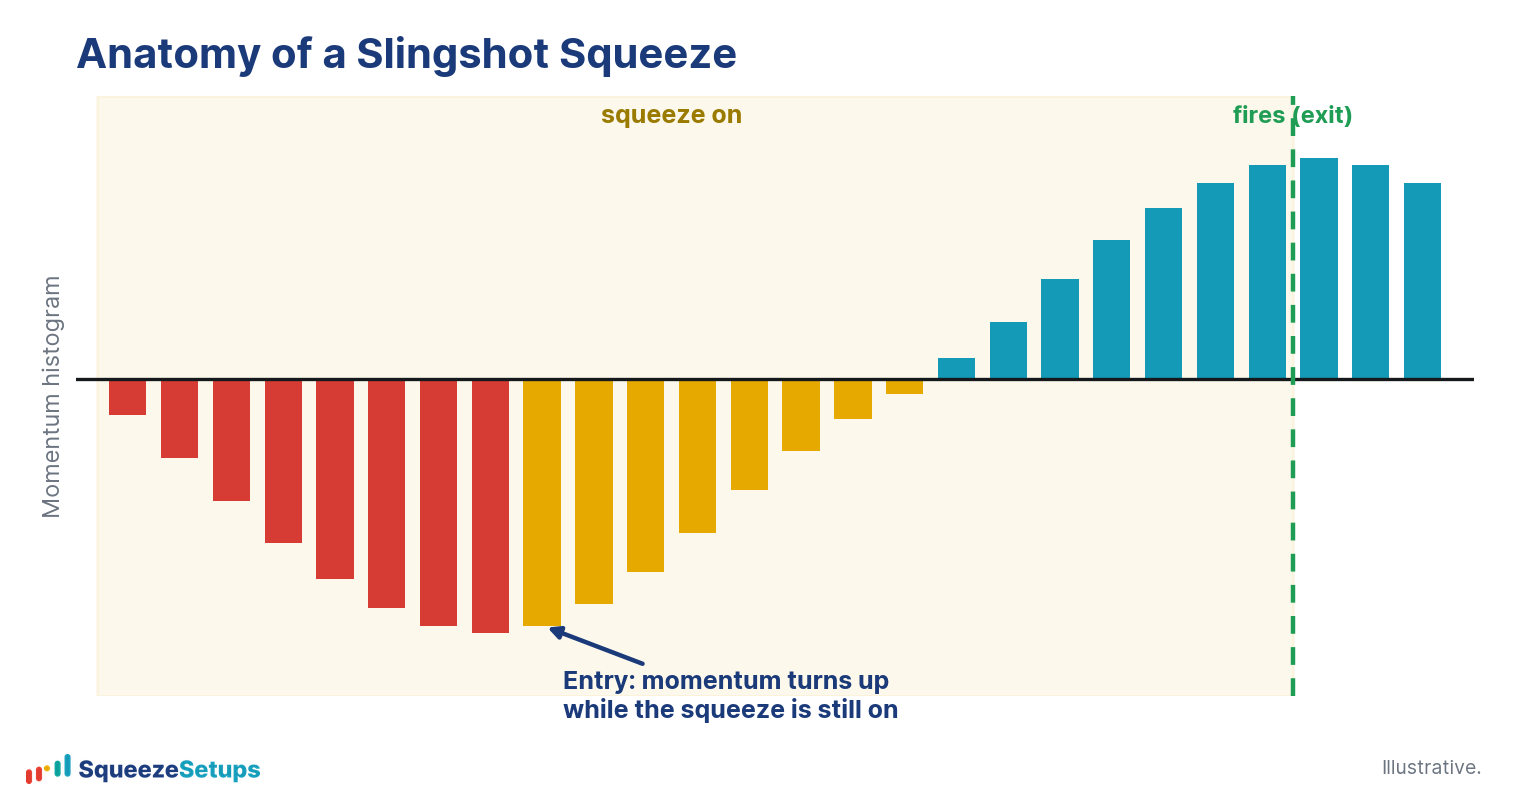
What turns a near-random signal into something tradable is filtering plus a per-symbol track record. We score every setup on three pillars: a backtest edge (the symbol’s own 22-year record), timeframe confluence (how many timeframes are compressed at once), and trend (the EMA 8 > 21 > 34 stack). Then we name the two filtered entries.
The two filtered entries tell a very different story than the bare signal:
- Slingshot Squeeze: momentum turns up from below zero while the squeeze is still on, in a stacked uptrend, with Edge Signal confirmation. On daily data it won 69.1% over 5,852 trades, with +0.93% average per trade and a hold around 13 days. Its win rate held between 66.8% and 70.9% across five separate eras, so the result is not driven by a single period.
- Squeeze Signal: a continuation entry where momentum is already above zero and the compression tightens a tier. It won 67.4% over 4,496 daily trades at +0.71% per trade, era-stable between 64.9% and 71.3%.
(Daily is the validated set; the intraday Squeeze Signal backtest is still in progress.)
Compare those to the 53.9% bare-squeeze baseline. The roughly fifteen-point jump did not come from a different histogram formula. It came from requiring a stacked trend, requiring confluence, adding Edge Signal confirmation, and only trading symbols whose own history supports it. That last point matters: the short version of the Slingshot won 60.3% but had negative expectancy (about -2.0% per trade), so we are long-biased by default and only consider shorts on names with a positive per-symbol short record.
So which should you use?
If you already run LazyBear’s Squeeze Momentum and you read its histogram well, you are not missing some hidden signal by not switching indicators. The honest framing is that the indicator gets you to a near-coin-flip starting point, and that is true of every squeeze flavor. What we add on top of that base is the filtering and the per-symbol 22-year record, surfaced on the Squeeze Board so you can rank rows by edge instead of eyeballing one chart at a time.
Even the strongest filtered entry, the daily Slingshot at 69.1%, means one trade in three still lost. Every figure here is a historical backtest, before commissions and slippage, and never a forecast. The indicator choice is the easy part. The filtering is the work.
Please note: This research is based on historical backtest data. It is NOT a prediction, and it is NOT financial advice.
Related: Momentum colors and the turn, What is the squeeze?, How to trade the squeeze