Squeeze Expectancy by Timeframe: 5-Minute to Weekly
Key takeaways:
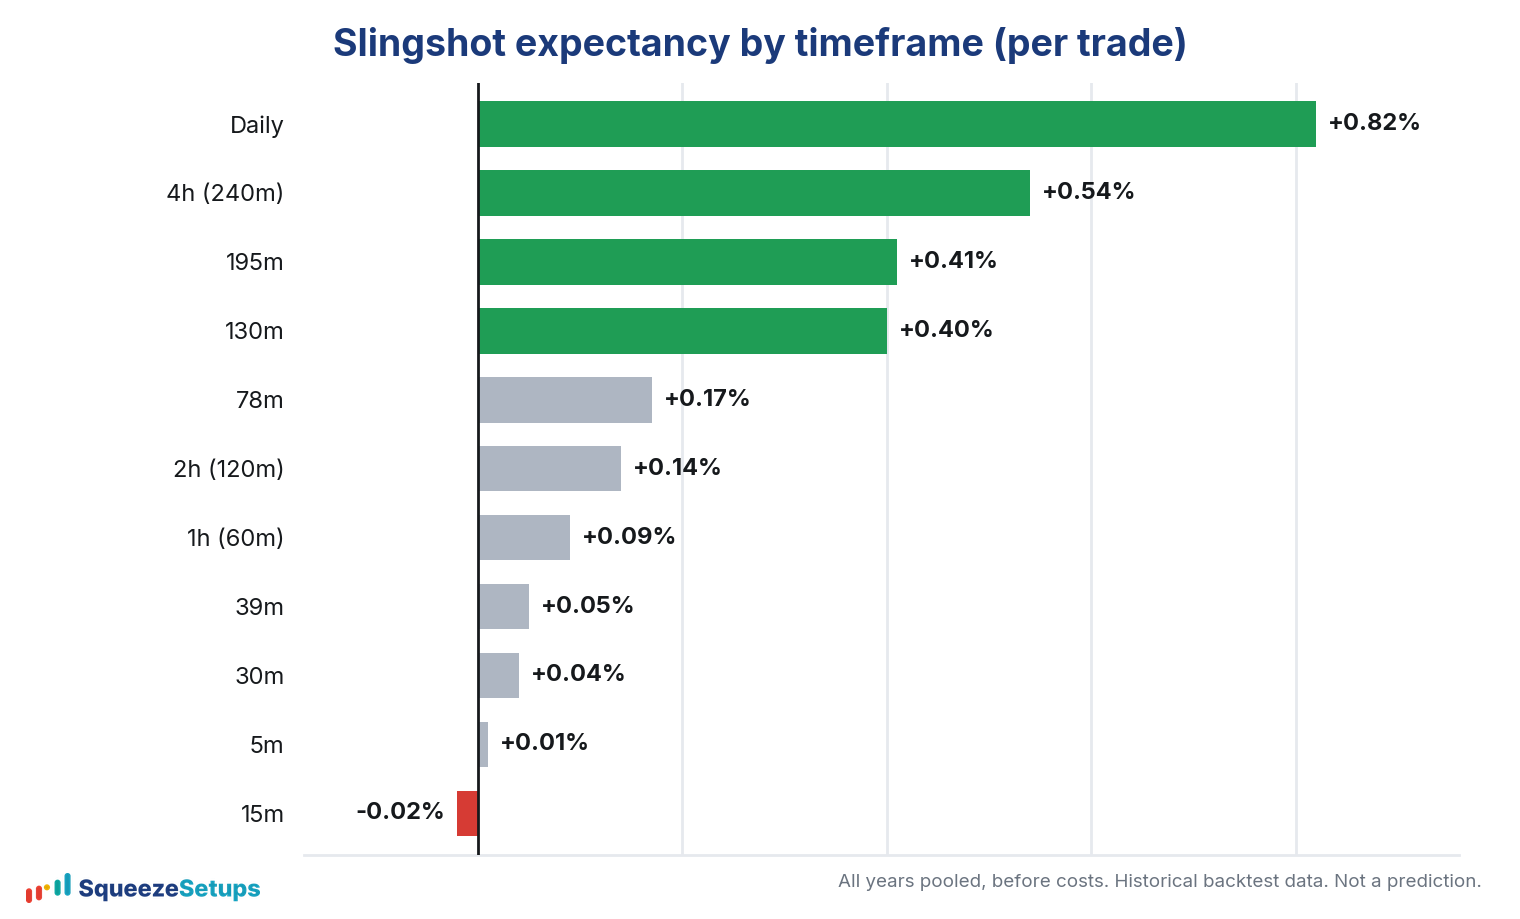
- Across our 22-year backtest, the daily Slingshot Squeeze has the highest expectancy at +0.82% per trade.
- The slower intraday timeframes (4h, 195m, 130m) are positive but smaller; the fastest (5m, 15m, 30m) sit near or below zero.
- Daily has the biggest average, but the 130-minute has been the steadiest year to year, and it held up better in 2026 so far.
- This page covers the Slingshot Squeeze only. The intraday Squeeze Signal backtest is still validating.
Not every timeframe pays the same. When we ran the Slingshot Squeeze across our universe of 652 stocks on daily data from 2004 to 2026, then repeated the test on each intraday timeframe from 2006, the expectancy per trade fell off as the bars got faster. The daily setup earns about +0.82% per trade.
The four-hour earns roughly +0.54%. By the time you reach the 5-minute and 15-minute charts, expectancy is essentially noise: +0.01% and about -0.02%. The setup and rules are the same; the payoff depends on which timeframe you trade it on.
What is the expectancy per timeframe?
Expectancy per trade is the average result you would expect across many trades: win rate times average win, minus loss rate times average loss. It is the single number that tells you whether a setup is worth taking at all.
Below is the full Slingshot Squeeze expectancy by timeframe from our backtest, ranked from strongest to weakest.
| Timeframe | Expectancy per trade | Win rate | Trades |
|---|---|---|---|
| Daily | +0.82% | 68.1% | 6,536 |
| 4h / 240m | +0.54% | 67.1% | 9,668 |
| 195m | +0.41% | 67.1% | 10,003 |
| 130m | +0.40% | 66.6% | 14,063 |
| 78m | +0.17% | 65.1% | 22,546 |
| 2h / 120m | +0.14% | 66.0% | 16,924 |
| 1h / 60m | +0.09% | 64.8% | 29,922 |
| 39m | +0.05% | 63.8% | 45,198 |
| 30m | +0.04% | 62.7% | 54,114 |
| 5m | +0.01% | 62.1% | 284,182 |
| 15m | about -0.02% | 61.7% | 106,731 |
Two things stand out. First, daily is not just the best, it is the best by a wide margin: about one and a half times the next timeframe.
Second, the order is not perfectly monotonic by clock speed (78m beats 120m, for example), but the trend is unmistakable. The slower you trade the Slingshot, the more it pays, and daily is at the top.
Why does daily carry the biggest edge?
A daily bar reflects activity across the whole session: the open auction, the midday drift, the close. By the time the day prints, the random back-and-forth that fills a 5-minute candle has largely netted out, and what remains is closer to actual direction. The Slingshot Squeeze is a directional setup.
It enters when momentum turns up from below zero while the squeeze is still on, in a stacked uptrend, with Edge Signal confirmation. That signal is far more reliable when the bar feeding it is a full day of conviction rather than five minutes of order flow.
Fast timeframes also pay a heavier cost relative to the move they capture. Spreads, slippage, and the occasional whipsaw are roughly fixed per trade, but the average move on a 5-minute bar is tiny. So even when the win rate holds up, the edge per trade shrinks toward zero.
Remember that all of these figures are gross: they are before commissions and slippage. A +0.01% gross expectancy on the 5-minute chart is, in practice, a losing proposition once costs are subtracted, while the 15-minute is already negative on paper. The daily +0.82% has real room to absorb costs and still come out ahead.
Finally, look at how each timeframe holds up across time. The daily Slingshot wins 68.1% of trades over 6,536 signals, but its average comes in lumps. It lost money in 5 of 23 years (2008, 2012, 2015, 2022 and 2023), and in 2026 so far it is roughly flat: +0.05% per trade over 288 trades.
The 130-minute has been steadier. It lost money in 4 of 21 years, stayed positive through 2022 and 2023, and is +0.55% per trade over 581 trades in 2026.
The fast charts are steady in a different way: the 5-minute wins 62% of the time and never averaged more than +0.13% per trade in any year since 2006. A high win rate with tiny wins is not an edge to lean on.
How to use this on the board
The practical takeaway is to weight your attention toward the slower timeframes. When you scan the Squeeze Board, a gold Slingshot arrow on the daily timeframe is worth more than the same arrow on the 5-minute, and now you know roughly how much more. You can act on this directly in the product.
The Timeframes picker chooses which timeframe columns appear in the Squeeze Matrix, so you can hide the fast charts entirely and rank only on the timeframes that pay. Pair that with a minimum-expectancy filter and the board surfaces the names where the daily edge is doing the work.
None of this guarantees the next trade. Even on the daily, one trade in three still lost.
Expectancy is an average over thousands of signals, not a promise about any single setup.
But if you are going to trade the Slingshot Squeeze, the timeframe you choose is one of the few levers fully in your control, and the data points to the slower charts: daily for the biggest average, the 130-minute for the steadiest.
What about the Squeeze Signal?
This page is scoped to the Slingshot Squeeze on purpose. The Squeeze Signal is validated on daily data (67.1% win, +0.65% per trade over 4,843 trades), but its intraday backtest is still in progress.
We do not publish per-timeframe Squeeze Signal expectancy until that work is finished and era-tested the same way the Slingshot was. When it is ready, it will get its own page with its own numbers.
Please note: This research is based on historical backtest data. It is NOT a prediction, and it is NOT financial advice.
Related: The Slingshot Squeeze explained, Backtesting the squeeze: 22 years per symbol, The Timeframes picker and power features