Squeeze Seasonality: The Best and Worst Months in 22 Years of Trades
FAIL: error: no such post
Key takeaways
- Across 10,574 daily long squeeze trades since 2004, November has been the best month to be in a squeeze trade: a 73.7% win rate and +2.51% per trade, roughly triple the all-months average.
- September is the weakest month in the study (61.6%, +0.28%), with February close behind (64.8%, +0.13%).
- The strong window is a season, not a fluke month: November, December, and January all cleared a 71% win rate.
- Even the worst month still won more than 60% of trades. Seasonality in this data is a tilt on a working edge, never a reason to sit out a good setup.
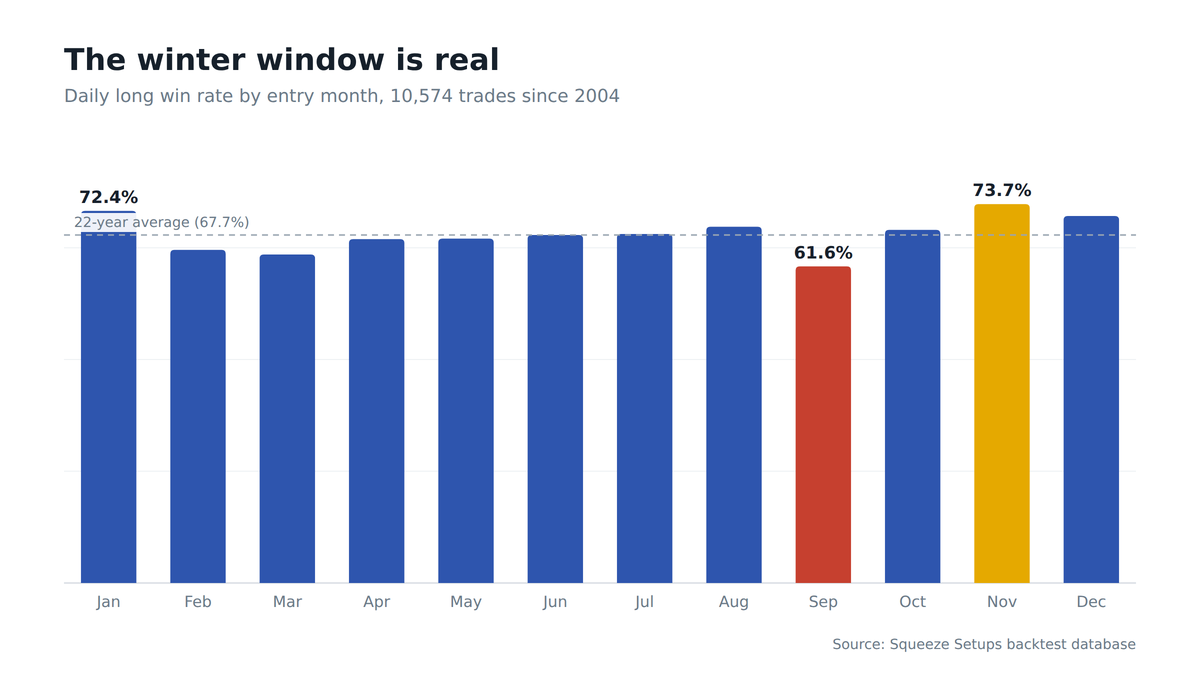
Squeeze setups fire year-round, but the market they release into changes with the calendar. So we took every daily long trade from both triggers, 2004 through today, and grouped 10,574 of them by entry month.
The spread between the best and worst month turned out to be wider than we expected. About twelve points of win rate, and more than two full percentage points of average return.
These are the same trigger-confirmed entries behind our core study of whether the squeeze actually works. This article just asks when the calendar helps and when it does not.
The month-by-month record
| Entry month | Trades | Win rate | Avg return |
|---|---|---|---|
| January | 1,054 | 72.4% | +1.47% |
| February | 820 | 64.8% | +0.13% |
| March | 1,012 | 63.9% | +0.34% |
| April | 900 | 66.9% | +0.40% |
| May | 779 | 67.0% | +0.60% |
| June | 849 | 67.7% | +0.75% |
| July | 851 | 67.9% | +0.77% |
| August | 822 | 69.3% | +1.10% |
| September | 865 | 61.6% | +0.28% |
| October | 883 | 68.7% | +0.37% |
| November | 843 | 73.7% | +2.51% |
| December | 896 | 71.4% | +1.09% |
The winter window
November, December, and January form a distinct block: every one above 71% winners, with November’s +2.51% per trade the single best cell in the table.
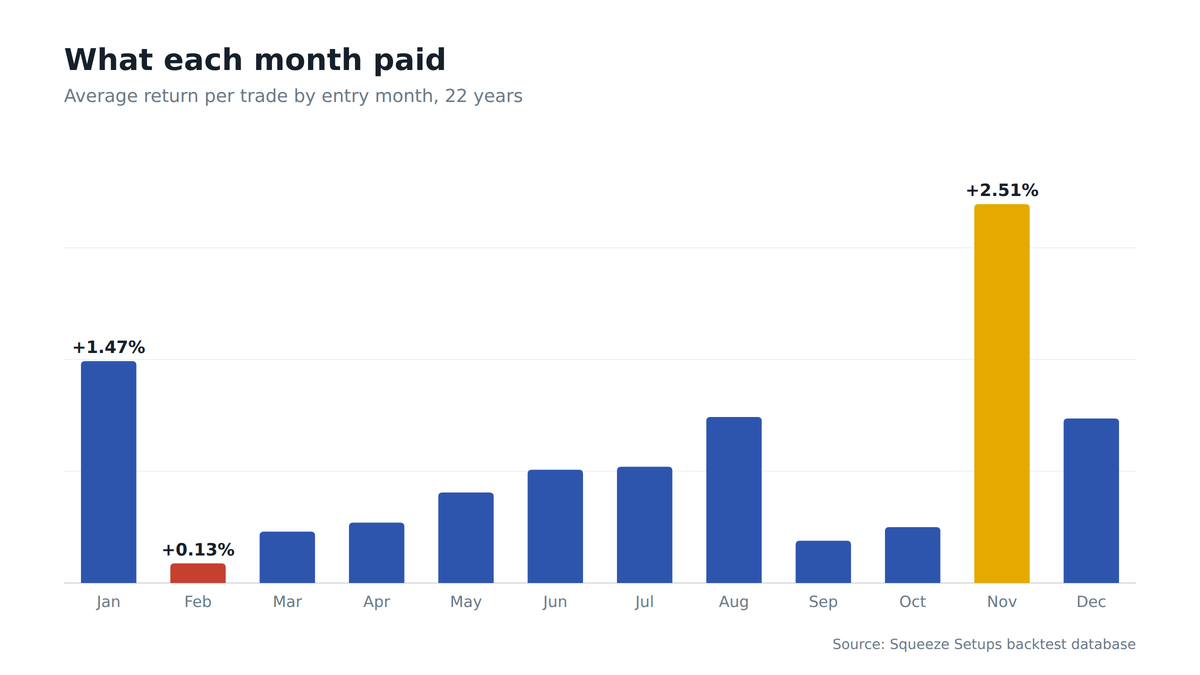
A long squeeze is a bet on upside volatility expansion. The turn of the year is historically when equities have their most reliable tailwind:
- Buybacks resume: corporate buying comes back online after earnings blackouts.
- Fund flows reset: new-year allocations put fresh money to work.
- Old calendar effects: the market’s most durable seasonal patterns cluster at the turn of the year.
A squeeze that fires into that backdrop has been getting an extra push for two decades.
The soft months
September earns its reputation on the other side. It is the only month under 62%, and its average return is barely positive.
February and March are the sneaky soft spot. Win rates are respectable, but the average returns, +0.13% and +0.34%, say the winners run short. Late winter has historically paid squeeze traders in singles, not doubles.
What we do and do not conclude
First, what we do not conclude: skip September. Its 61.6% win rate would still be a strong strategy on its own.
What we do conclude is about expectations and aggression. The same signal has historically been worth about three times more per trade in November than in March.
That argues for calibration, not abstinence:
- Press the strong season: when the tailwind and the trigger agree, hold winners to a longer leash.
- Respect the soft months: take the setups, but history says the follow-through runs shorter.
- Never sit out on the calendar alone: the edge never turned off in any month, a pattern consistent with how the squeeze edge held in every era since 2004.
The edge just breathes with the calendar. Now you know its rhythm.
The fine print
- Monthly cells mix many years: 800-plus trades per month means one brutal September (there have been a few) drags an average. Each cell also blends many symbols, and per-symbol results vary.
- Seasonality is easy to overfit: monthly patterns are the easiest thing in finance to overfit, which is why we present the whole table rather than the two cells that make the best story.
- These are trigger-confirmed entries: the study counts full setups, because a bare squeeze has no edge on its own.
- Daily bars only: this table covers daily trades; expectancy shifts by timeframe, so do not project these monthly numbers onto intraday setups.
Further reading
Frequently asked questions
Which month has the best squeeze win rate?
73.7% is November’s win rate, the strongest of any month across 843 trades in 22 years of data. It also posted the best average return in the table at +2.51% per trade, roughly triple the all-months average.
What is the worst month to hold a squeeze trade?
61.6% is September’s win rate, the lowest in the study across 865 trades, with an average return of just +0.28%. It is the only month under 62%, yet it still won more than 6 of every 10 trades.
Is there a seasonal window when squeeze trades perform best?
November, December, and January each cleared a 71% win rate, forming a distinct winter block: December at 71.4%, January at 72.4%, and November leading at 73.7%. A long squeeze firing into the turn-of-year tailwind has been getting an extra push for two decades.
How big is the gap between the best and worst month?
About twelve points of win rate separate the best month from the worst, plus more than two full percentage points of average return. The same signal has historically been worth about three times more per trade in November than in March.
How many trades is this seasonality study based on?
10,574 daily long squeeze trades since 2004 were grouped by entry month for this study. Every trade is a trigger-confirmed entry from both daily triggers, covering 800-plus trades in each individual month, which keeps every monthly cell well populated.
Should I avoid trading squeezes in weak months like September?
61.6%, September’s win rate, would still be a strong strategy on its own, so the data does not support sitting out. Even the worst month won more than 60% of trades. Seasonality here is a tilt on a working edge, never a reason to skip a good setup.