Does Squeeze Tightness Matter? Yellow vs Red vs Black Dots, 4,509 Trades
Key takeaways
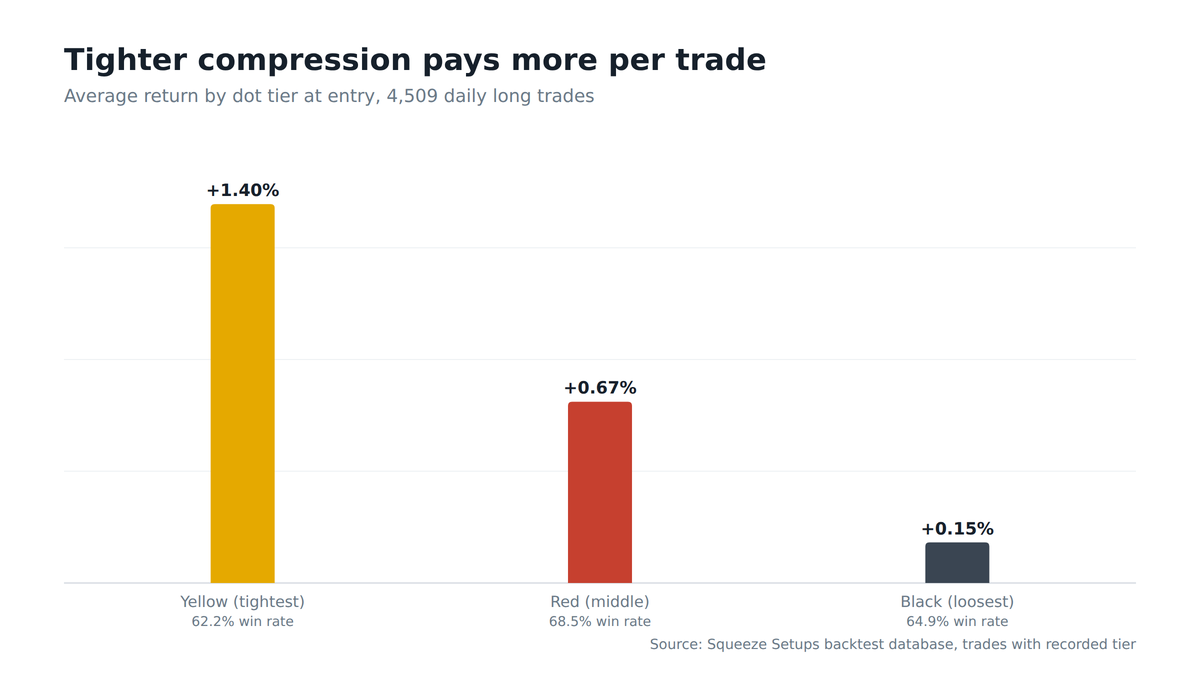
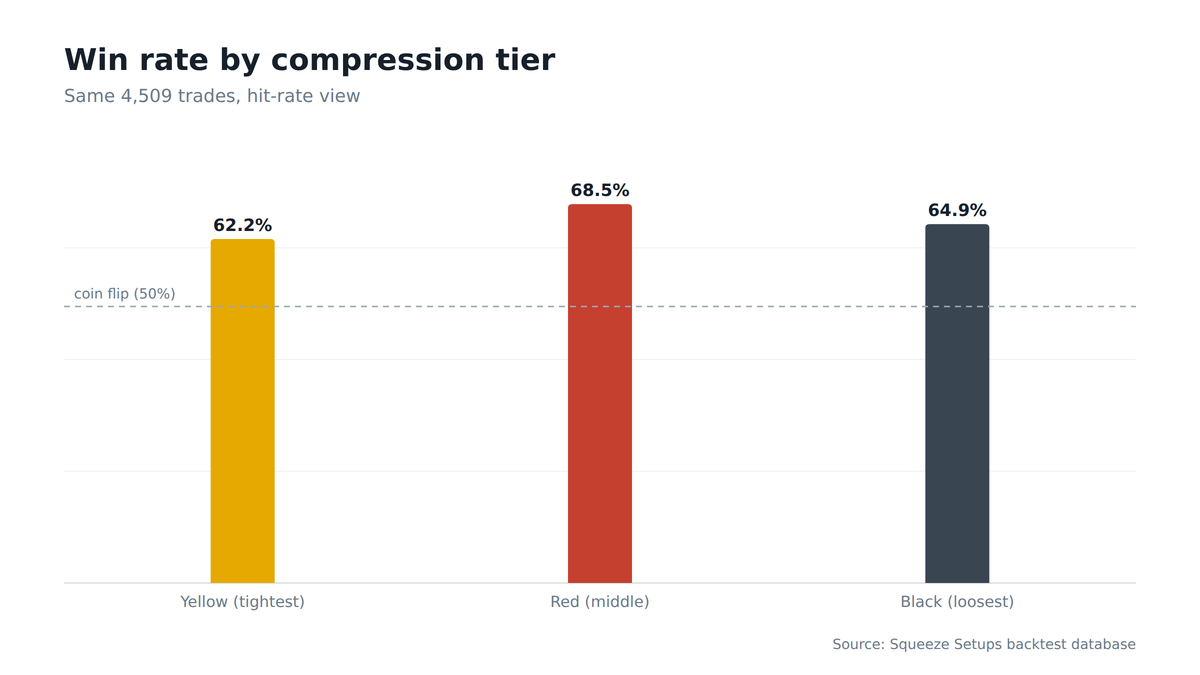
- Tightest pays most, wins least: among 4,509 daily long trades with a recorded compression tier, the tightest squeezes (yellow dots) won least often (62.2%) but paid the most per trade (+1.40%).
- The middle tier is the reliability play: mid-compression squeezes (red dots) posted a 68.5% win rate, with a smaller +0.67% average.
- The loosest tier is the trap: black dots showed a decent 64.9% win rate but only +0.15% per trade, the worst payoff in the study.
- Tightness is a risk dial, not a quality score: win rate and payoff pulled in opposite directions.
Our squeeze dots come in tiers: black is the loosest squeeze, red is tighter, and yellow is the tightest state the scanner tracks. A natural assumption is that tighter is simply better.
We went through every daily long trade in our backtest database with a recorded tier at entry: 4,509 trades across two decades. The answer turned out to be more interesting than a ranking.
The numbers by tier
| Tier at entry | Compression | Trades | Win rate | Avg return | Avg best point |
|---|---|---|---|---|---|
| Yellow | Tightest | 529 | 62.2% | +1.40% | +6.4% |
| Red | Middle | 3,478 | 68.5% | +0.67% | +5.0% |
| Black | Loosest | 502 | 64.9% | +0.15% | +5.9% |
Read the win column and red wins. Read the payoff column and yellow wins by a factor of two.
Read both and you see the actual structure: the tighter the compression, the less often the trade works and the more it pays when it does.
Why tightness trades win rate for payoff
The yellow trade-off
Mechanically this makes sense. A yellow-tier squeeze is a market wound to its extreme: the eventual release is violent, which is where the +1.40% average and the biggest best-point excursions come from.
But an extremely compressed market is also a market where the breakout direction is most contested. A violent release cuts both ways, which is what shaves the win rate.
The red tier is compression with commitment: enough energy stored to pay, enough directional lean to resolve cleanly two times in three.
The black-tier trap
The black tier is the cautionary row. It wins acceptably often, so it feels fine to trade, and then pays 15 basis points.
Loose compression means less stored energy, and the releases fizzle. If you are going to skip a tier, the data says skip the loose one, not the tight one.
How to use the tier
Treat the tier as a position-shape input rather than a filter.
- Red suits the core allocation: the highest hit rate in the study, with an ordinary payoff. That is the steady, base-size signal.
- Yellow suits a runner-hunting approach: expect to be wrong nearly four times in ten, size for that, and let the winners breathe, because the average winner from yellow compression travels further.
- Black demands backup: when a signal fires from barely-there compression, the record says demand more from the rest of the setup before committing.
The fine print
- This is a subset: tiers were recorded on 4,509 of the 10,515 daily long trades in our database, primarily on the Slingshot side, so this study describes that subset.
- Samples vary by tier: the yellow and black samples are hundreds of trades, not thousands.
- Backtest caveats apply: the usual caveats about fills and costs apply here too.
But the pattern is clean, it matches the mechanics of what compression is, and it converts the dot color from decoration into information.
Keep reading
- Slingshot Squeeze vs Squeeze Signal: Head to Head
- Squeeze Seasonality: The Best and Worst Months in 22 Years
Frequently asked questions
Do tighter squeezes perform better than looser ones?
Not in the way most traders assume. The tightest (yellow) squeezes won least often at 62.2% but paid the most at +1.40% per trade. Mid-compression (red) won most at 68.5% but paid +0.67%. The loosest (black) paid just +0.15%. Tightness is a risk dial, not a quality score.
What do the yellow, red, and black squeeze dots mean?
They mark the compression tier at entry. Black is the loosest squeeze, red is tighter, and yellow is the tightest volatility compression the scanner tracks. The color tells you how much energy the squeeze has stored, not which direction it will release.
Which squeeze compression tier has the highest win rate?
The middle (red) tier, at 68.5% across 3,478 daily long trades. It was the most reliable tier in the study, trading a smaller average payoff for the steadiest hit rate.
Do yellow (tight) squeezes pay more than red ones?
Yes. Yellow-tier trades averaged +1.40% versus red’s +0.67%, roughly double the payoff per trade, even though yellow won less often. The tighter the coil, the bigger the release when it works.
Is a loose (black-dot) squeeze worth trading?
It is the weakest setup of the three. Black-tier squeezes won a respectable 64.9% but returned only +0.15% per trade, so the releases tend to fizzle. The data says demand more confluence before taking a loose-compression signal.
How should I size trades based on squeeze tightness?
Treat the tier as position shape. Red suits a steady core allocation for its high hit rate; yellow suits a runner-hunting approach, sized for roughly four losers in ten while letting winners run; black warrants the most selectivity.
If you are weighing the classic Squeeze against Squeeze Pro, we put the three tiers side by side on win rate in Squeeze vs Squeeze Pro.